 36
36peptides
spectra
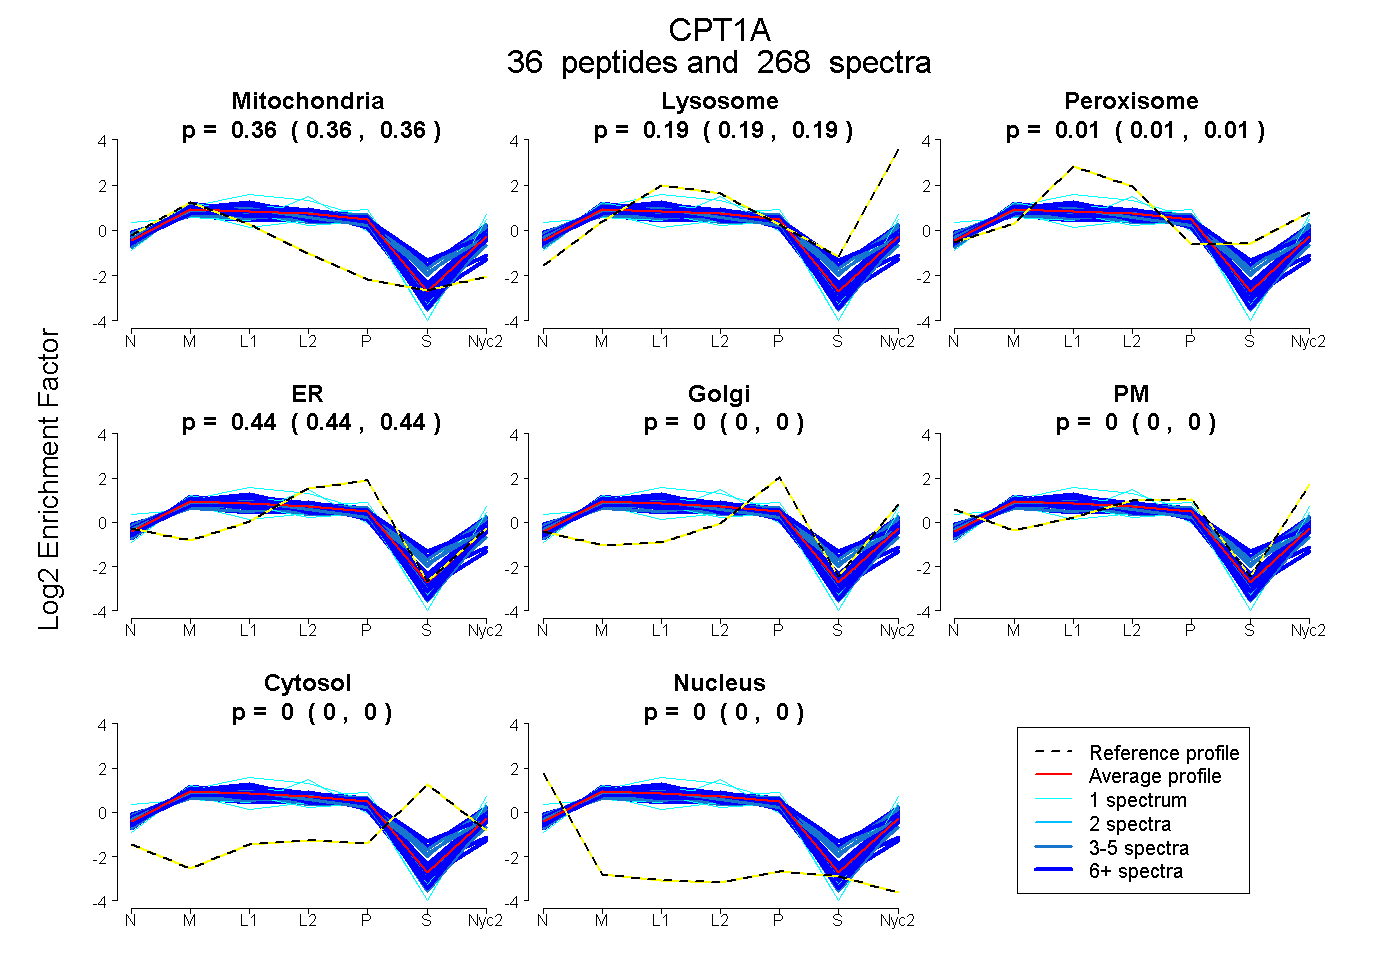
0.361 | 0.363
0.187 | 0.191
0.006 | 0.011
0.439 | 0.441
0.000 | 0.000
0.000 | 0.000
0.000 | 0.000
0.000 | 0.000
23peptides
spectra
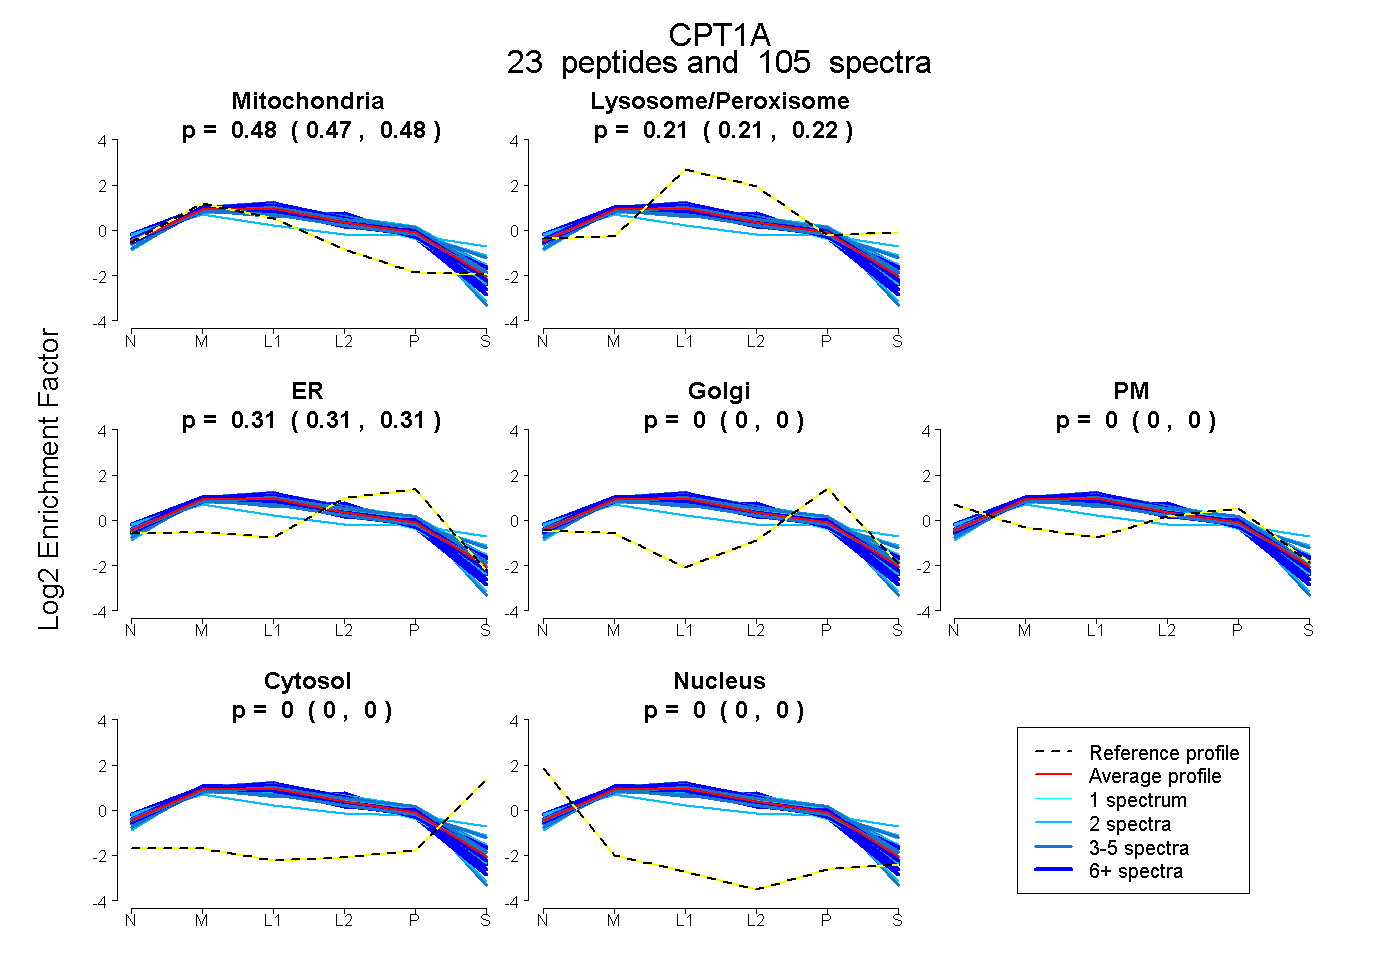
0.474 | 0.478
0.210 | 0.216
0.308 | 0.313
0.000 | 0.000
0.000 | 0.000
0.000 | 0.000
0.000 | 0.000
33peptides
spectra
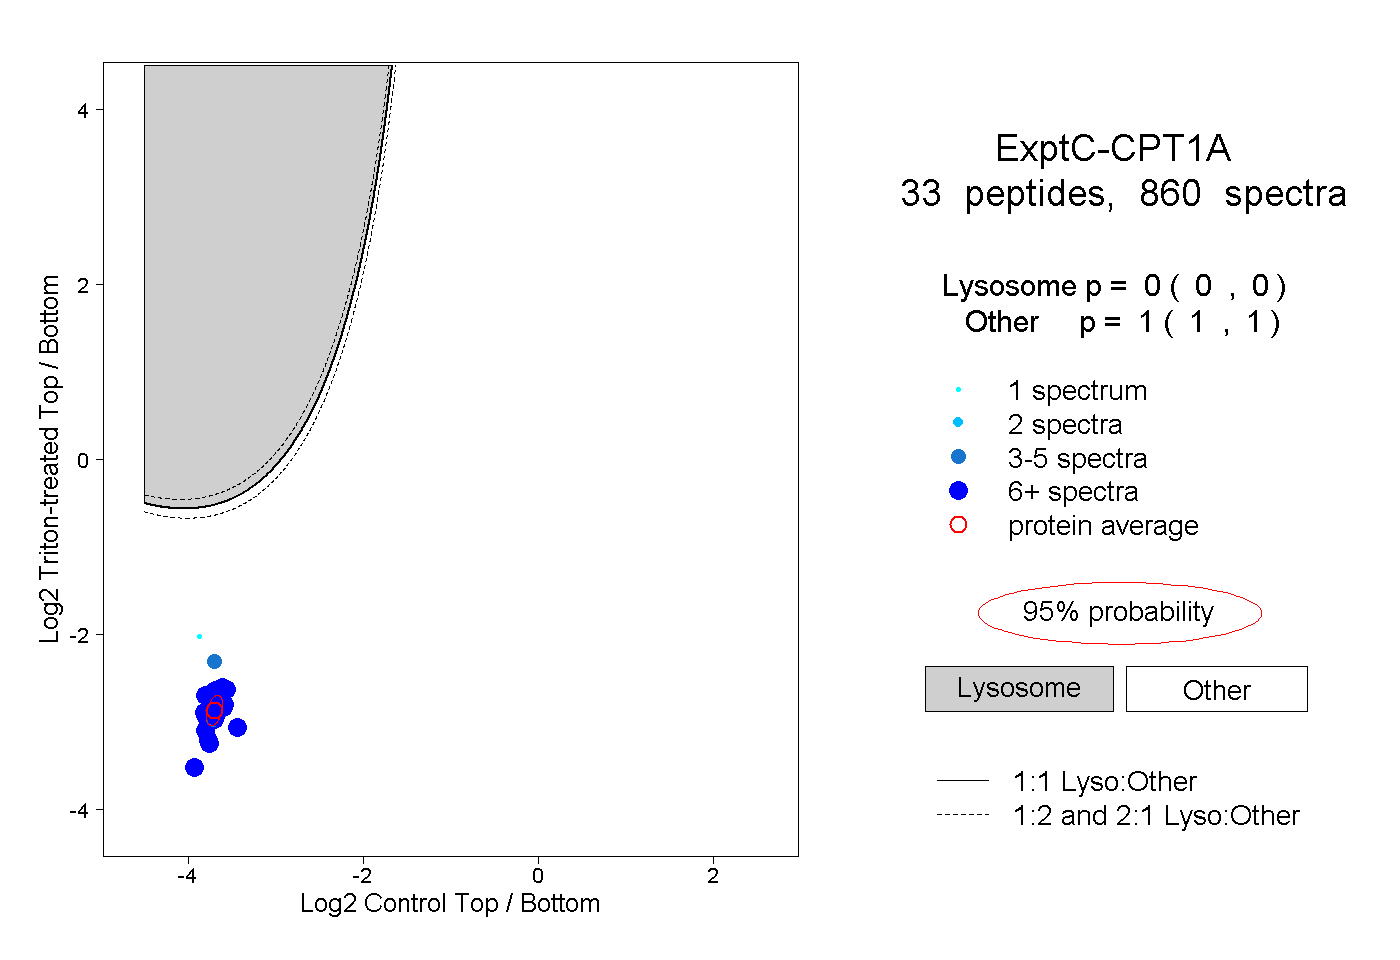
0.000 | 0.000
1.000 | 1.000
14peptides
spectra
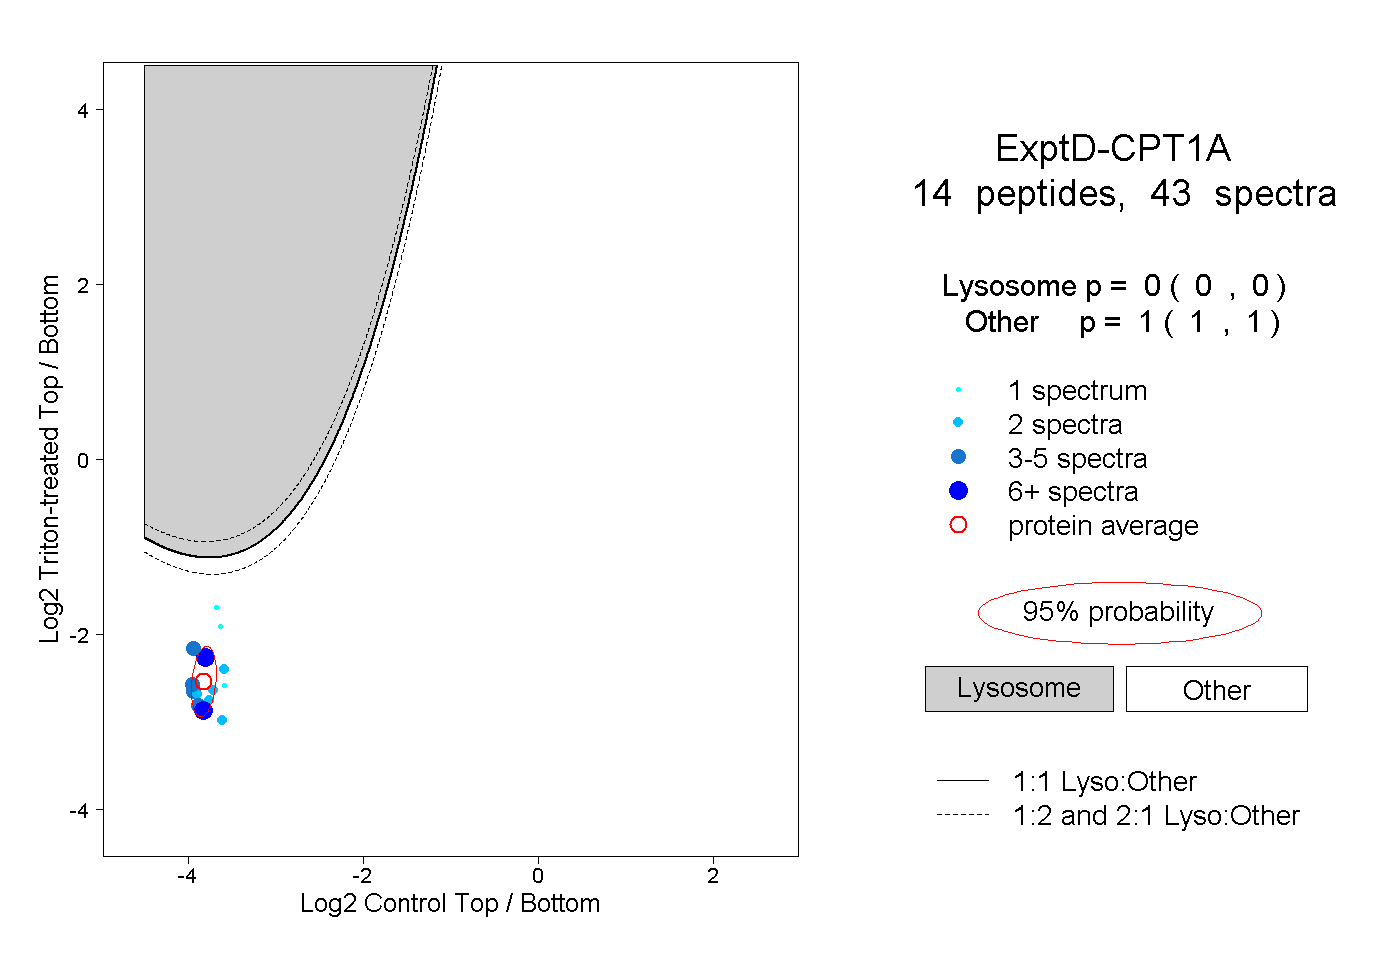
0.000 | 0.000
1.000 | 1.000