CPT1A
[ENSRNOP00000019652]
Main page
| | | Plot |
Mito |
Lyso |
|
Perox |
ER |
Golgi |
PM |
Cytosol |
Nucleus |
|
| Expt A |
 36
36
peptides |
268
spectra |
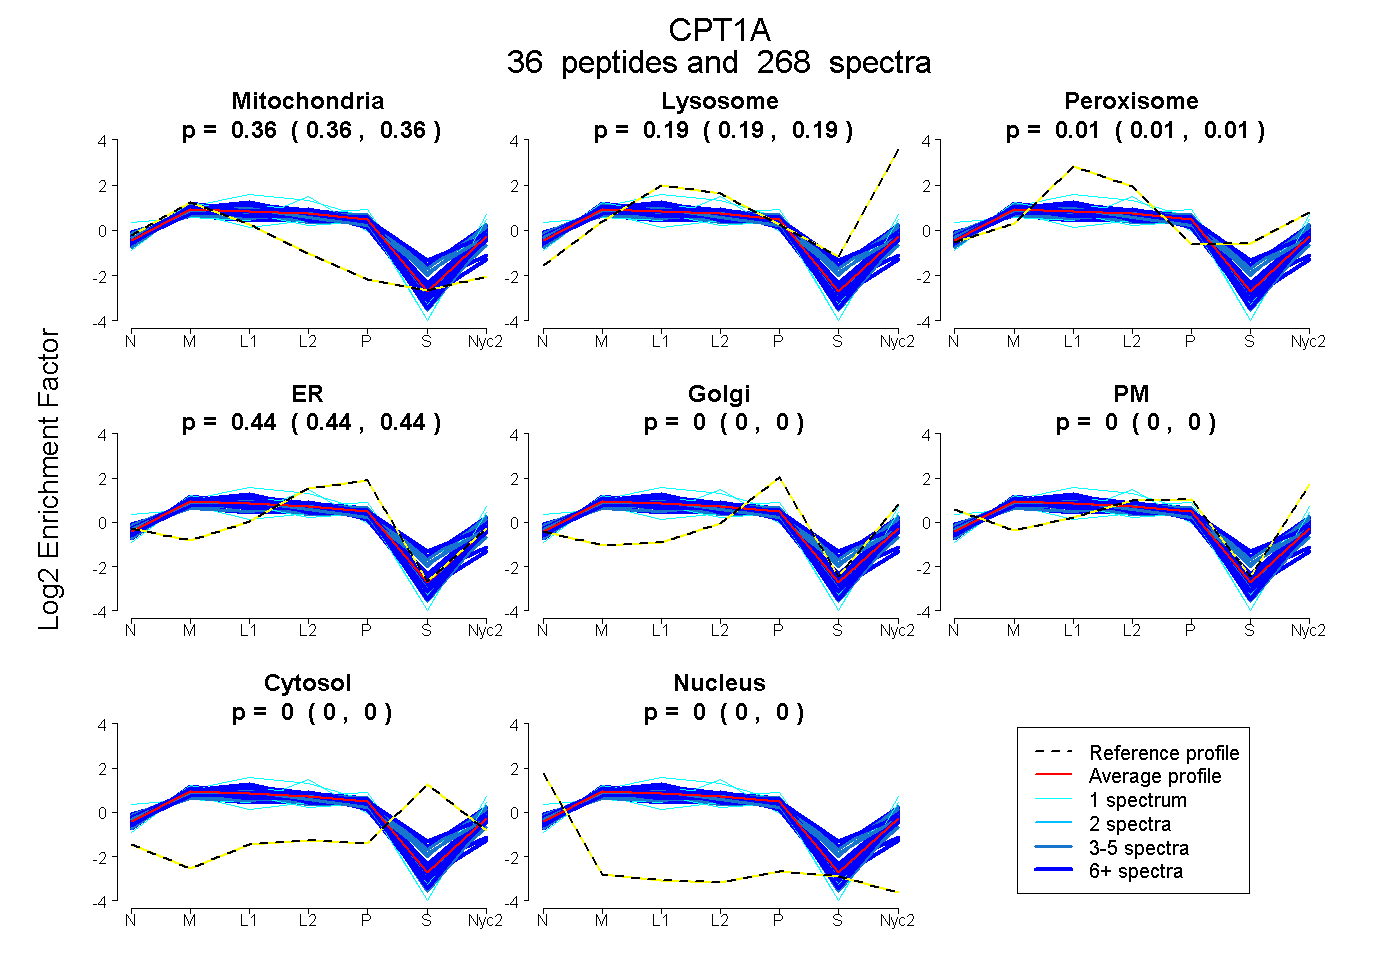 |
0.362
0.361 | 0.363 |
0.189
0.187 | 0.191 |
|
0.009
0.006 | 0.011 |
0.440
0.439 | 0.441 |
0.000
0.000 | 0.000 |
0.000
0.000 | 0.000 |
0.000
0.000 | 0.000 |
0.000
0.000 | 0.000 |
|
| | | Plot |
Mito |
|
Lyso or Perox |
|
ER |
Golgi |
PM |
Cytosol |
Nucleus |
|
| Expt B |
23
peptides |
105
spectra |
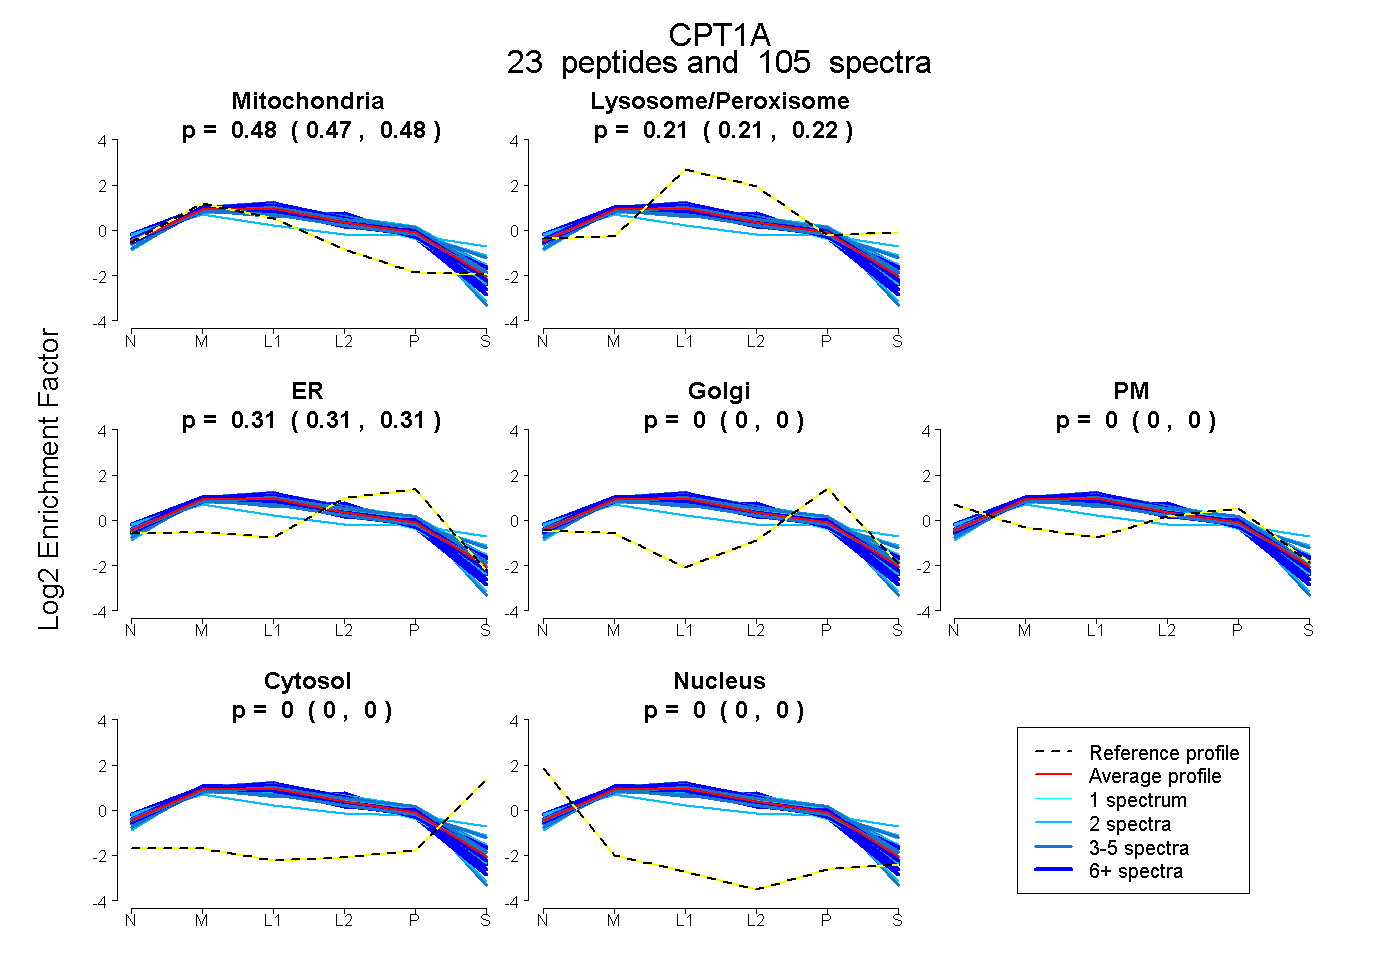 |
0.476
0.474 | 0.478 |
|
0.213
0.210 | 0.216 |
|
0.311
0.308 | 0.313 |
0.000
0.000 | 0.000 |
0.000
0.000 | 0.000 |
0.000
0.000 | 0.000 |
0.000
0.000 | 0.000 |
|
| | | Plot |
|
Lyso |
|
|
|
|
|
|
|
Other |
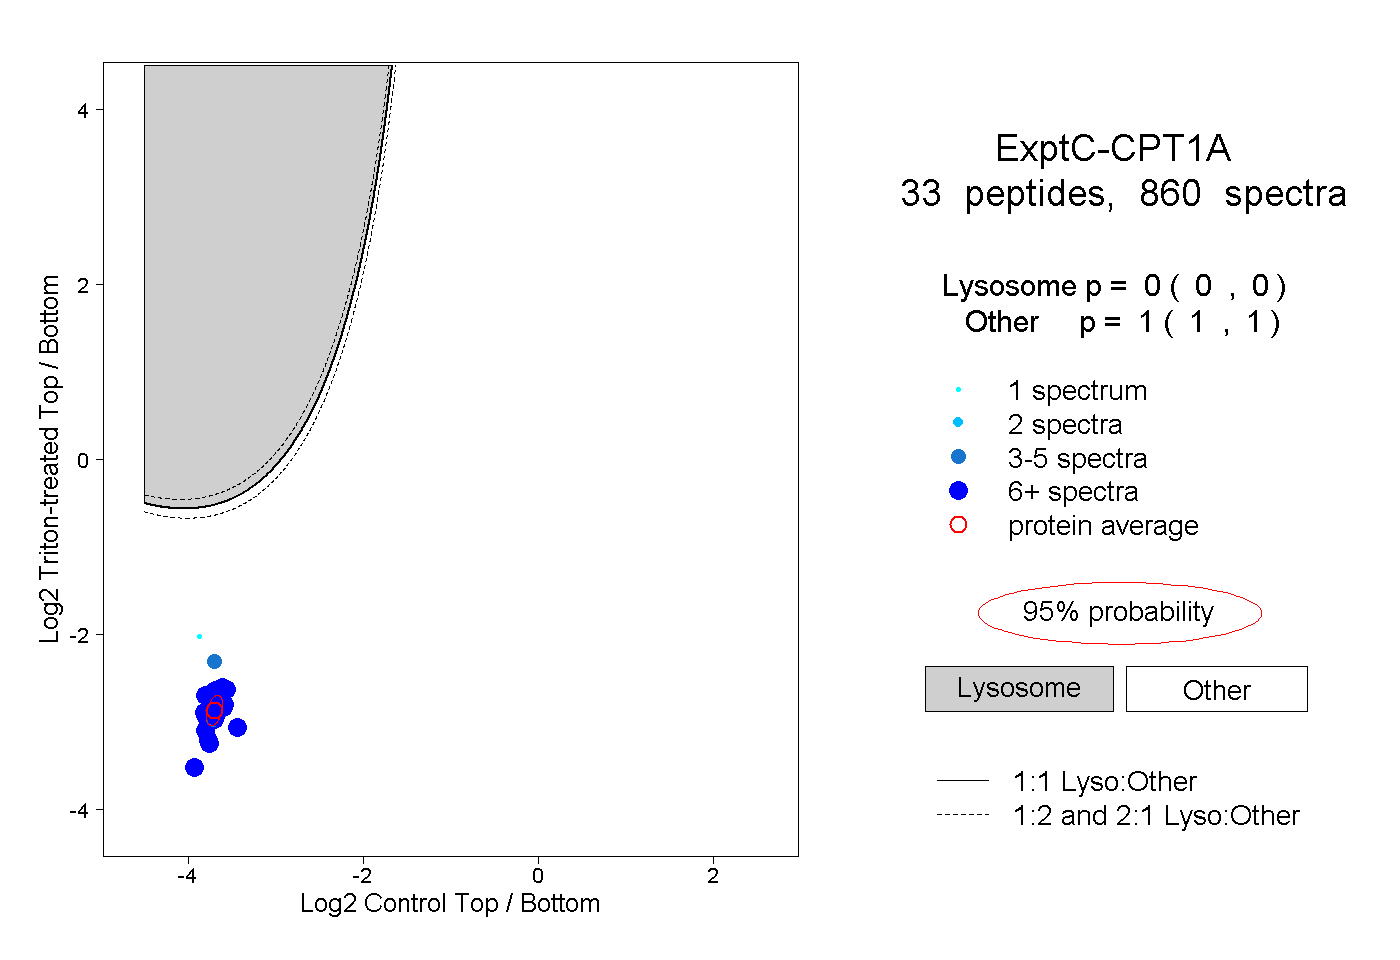
| Expt C |
33
peptides |
860
spectra |
 |
|
0.000
0.000 | 0.000 |
|
|
|
|
|
|
|
1.000
1.000 | 1.000 |
| | | Plot |
|
Lyso |
|
|
|
|
|
|
|
Other |
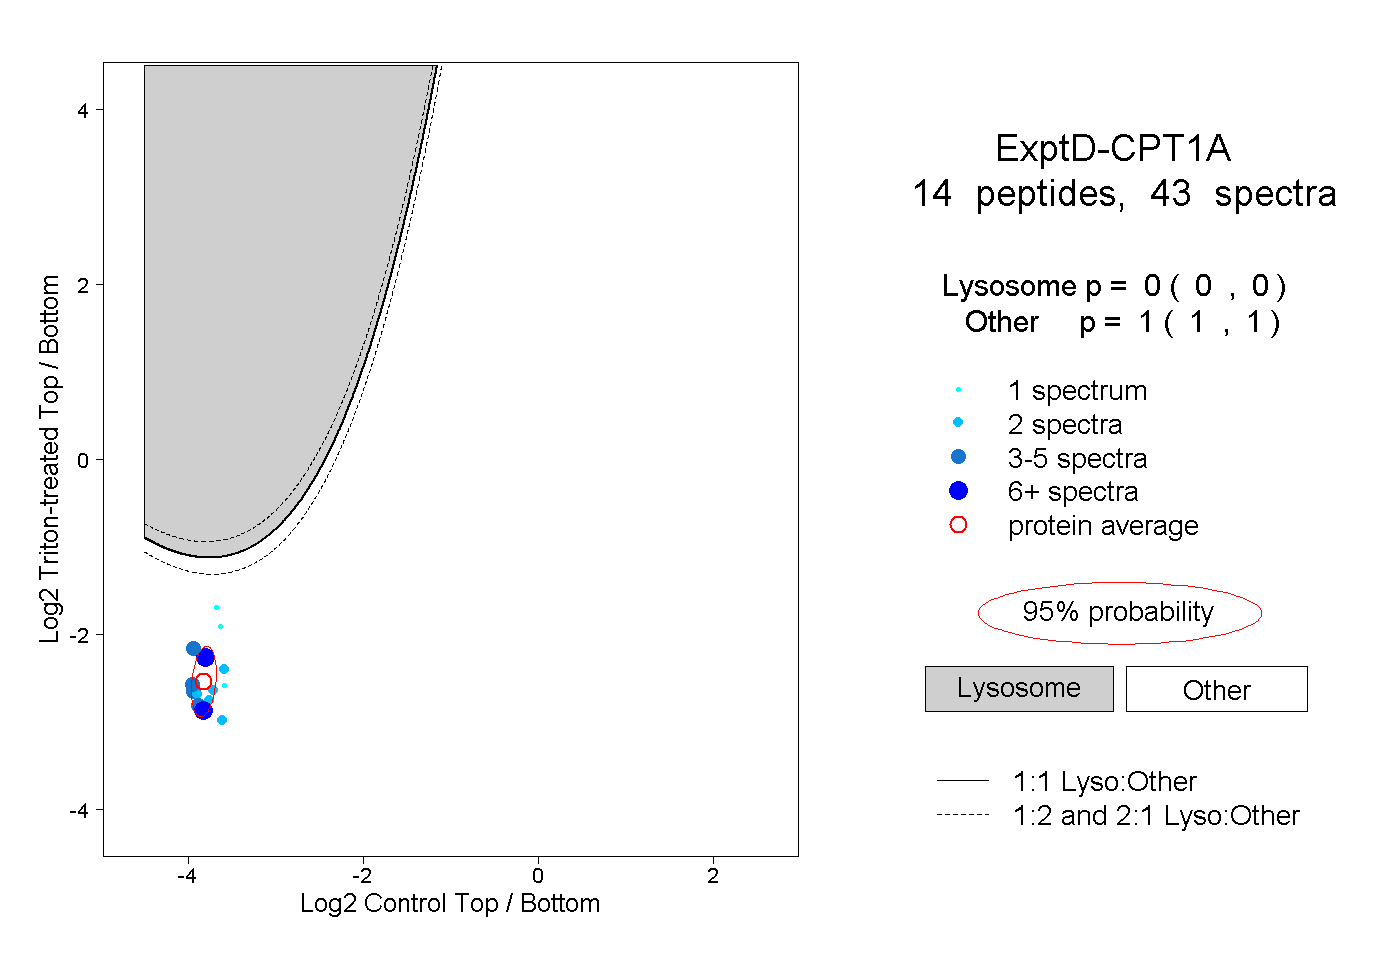
| Expt D |
14
peptides |
43
spectra |
 |
|
0.000
0.000 | 0.000 |
|
|
|
|
|
|
|
1.000
1.000 | 1.000 |
| 2 spectra, VWLYHDGR |
|
0.000 |
|
|
|
|
|
|
|
1.000 |
| 3 spectra, LQWYLK |
|
0.000 |
|
|
|
|
|
|
|
1.000 |
| 2 spectra, GDTNPNIPKPTR |
|
0.000 |
|
|
|
|
|
|
|
1.000 |
| 1 spectrum, EVLSEPWR |
|
0.003 |
|
|
|
|
|
|
|
0.997 |
| 7 spectra, TLDTTGR |
|
0.000 |
|
|
|
|
|
|
|
1.000 |
| 1 spectrum, SITFVVFK |
|
0.000 |
|
|
|
|
|
|
|
1.000 |
| 4 spectra, EELKPIR |
|
0.000 |
|
|
|
|
|
|
|
1.000 |
| 5 spectra, VDPSLGMIAK |
|
0.000 |
|
|
|
|
|
|
|
1.000 |
| 2 spectra, LPVPAVK |
|
0.000 |
|
|
|
|
|
|
|
1.000 |
| 1 spectrum, HIVVYHR |
|
0.015 |
|
|
|
|
|
|
|
0.985 |
| 4 spectra, QSLDAVEK |
|
0.000 |
|
|
|
|
|
|
|
1.000 |
| 2 spectra, YLAVDSPFLK |
|
0.000 |
|
|
|
|
|
|
|
1.000 |
| 7 spectra, LAMTGAGIDR |
|
0.000 |
|
|
|
|
|
|
|
1.000 |
| 2 spectra, QTYFAR |
|
0.000 |
|
|
|
|
|
|
|
1.000 |