 18
18peptides
spectra
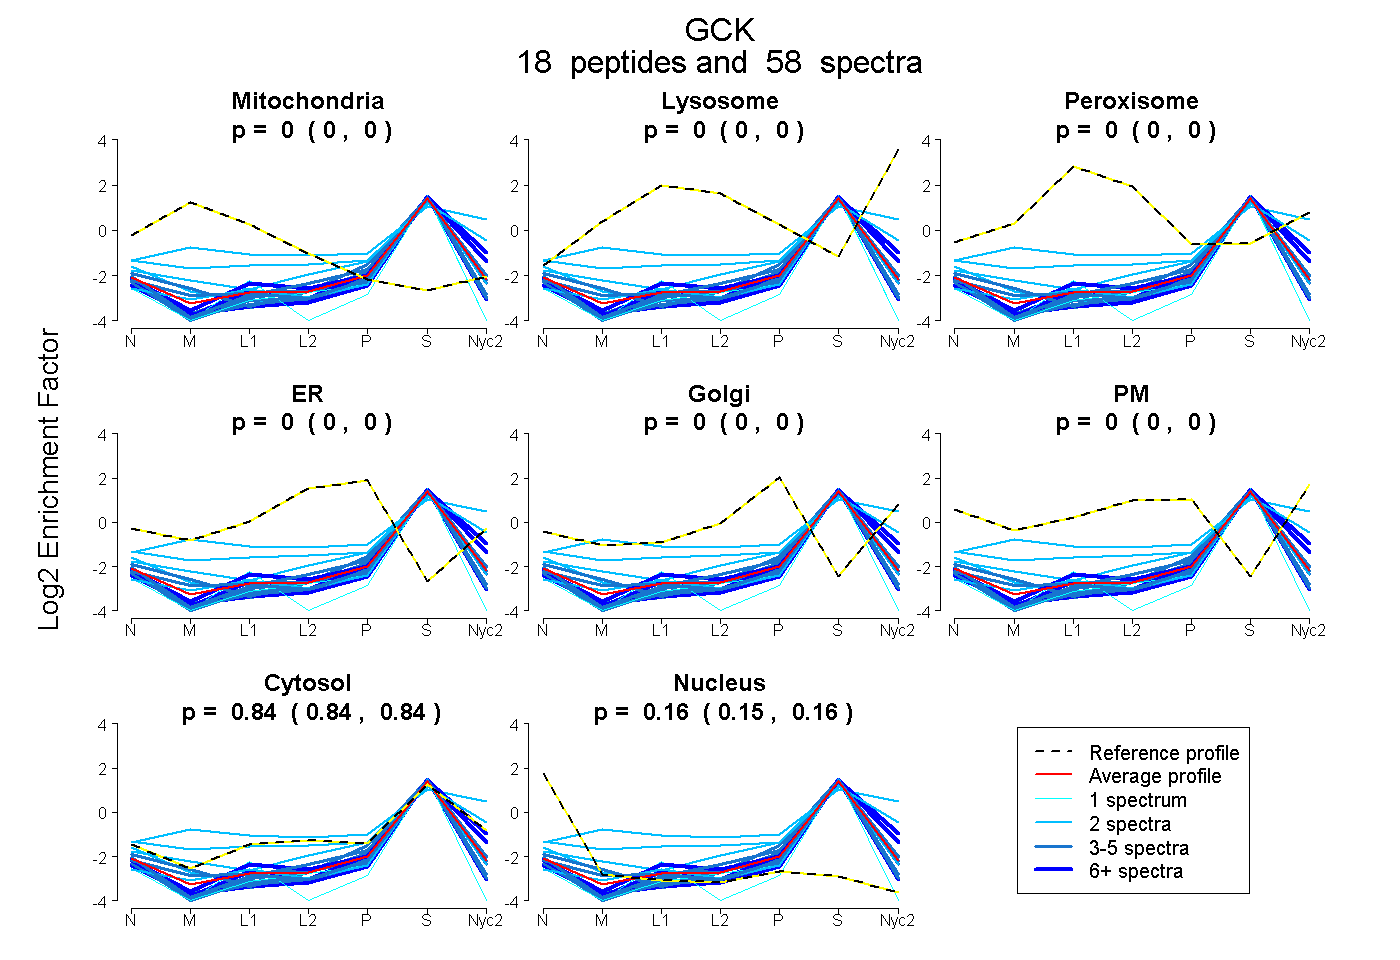
0.000 | 0.000
0.000 | 0.000
0.000 | 0.000
0.000 | 0.000
0.000 | 0.000
0.000 | 0.000
0.836 | 0.845
0.155 | 0.164
4peptides
spectra
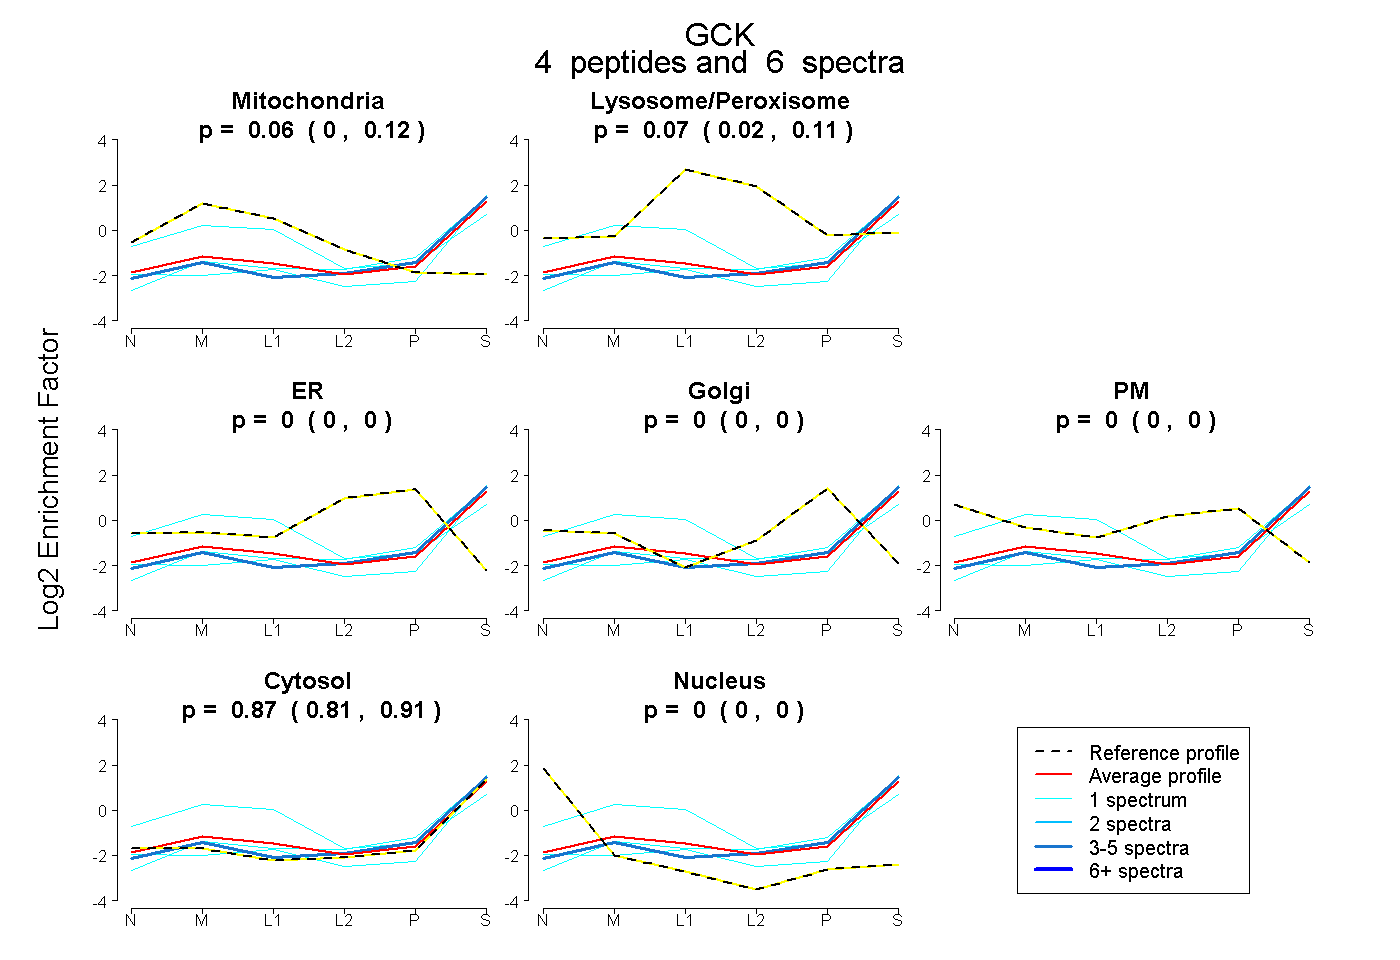
0.000 | 0.124
0.016 | 0.114
0.000 | 0.000
0.000 | 0.000
0.000 | 0.000
0.808 | 0.911
0.000 | 0.000
7peptides
spectra
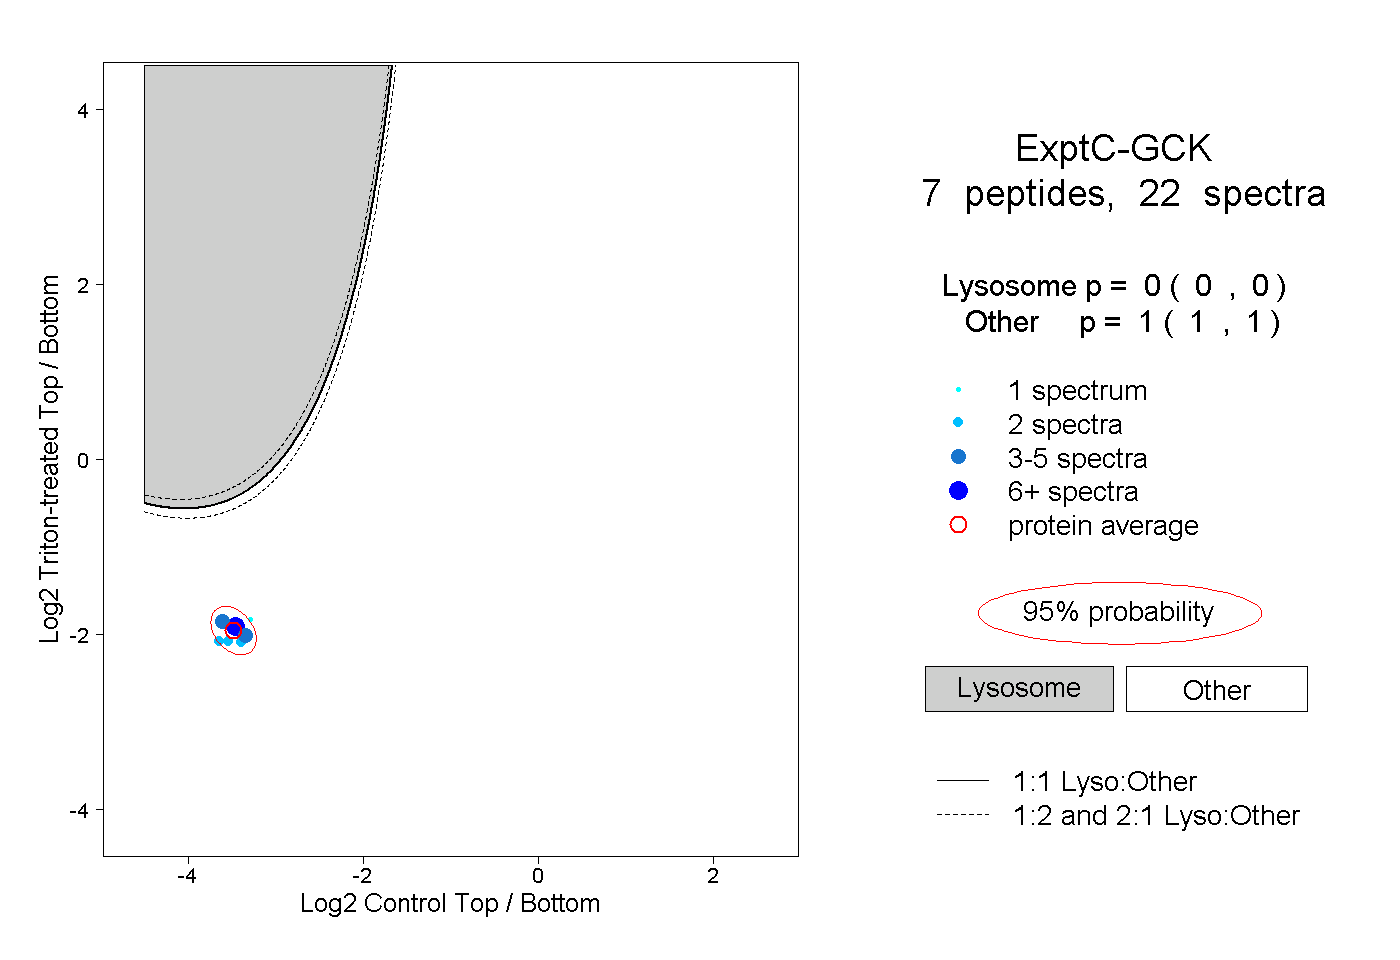
0.000 | 0.000
1.000 | 1.000