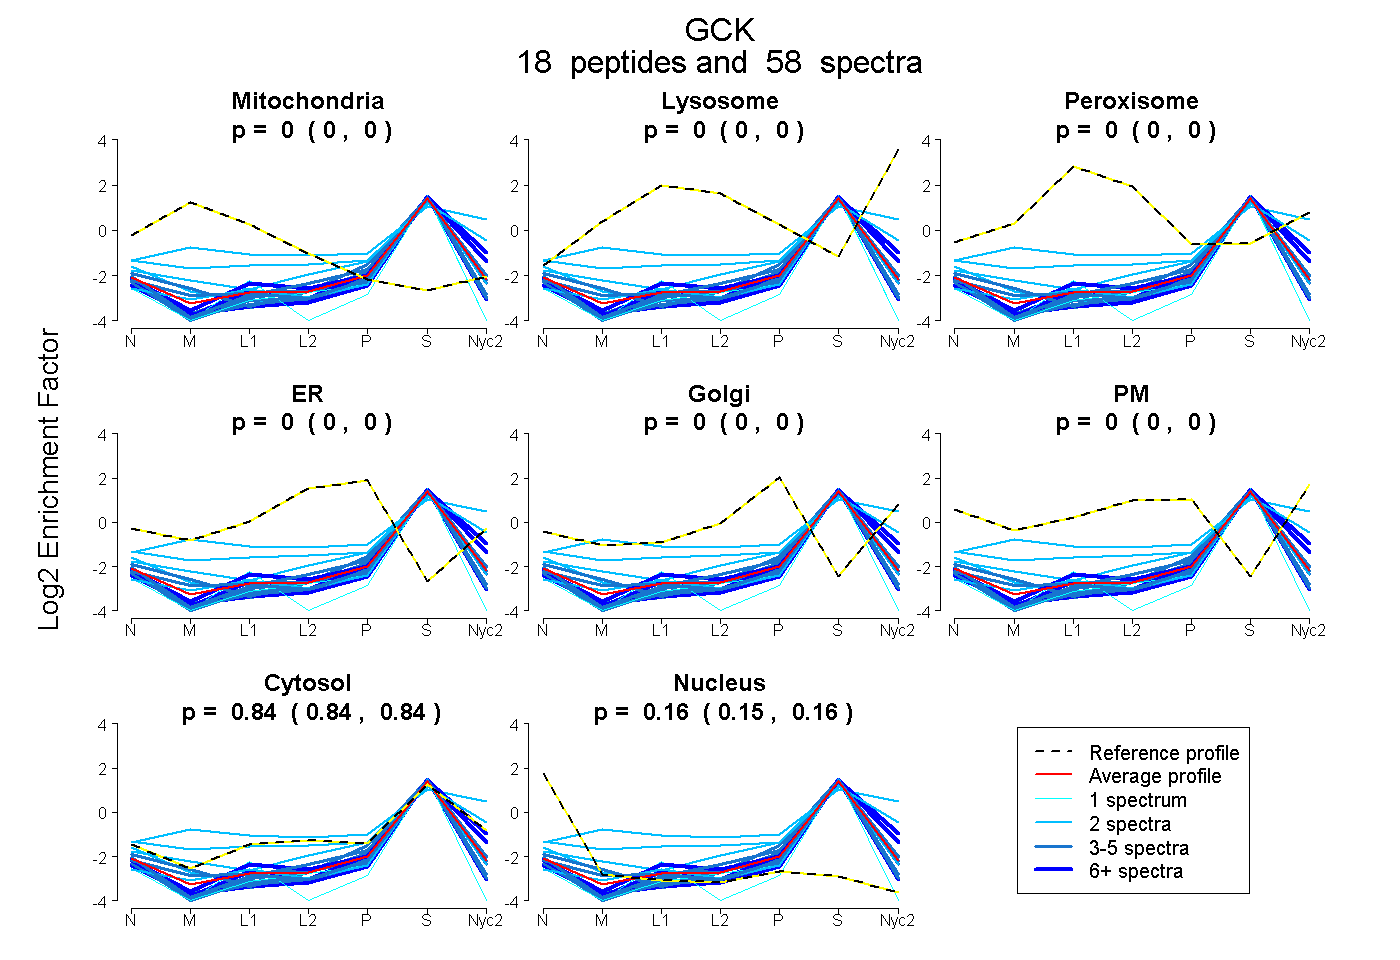
 18
18peptides
spectra
0.000 | 0.000
0.000 | 0.000
0.000 | 0.000
0.000 | 0.000
0.000 | 0.000
0.000 | 0.000
0.836 | 0.845
0.155 | 0.164
| Plot | Mito | Lyso | Perox | ER | Golgi | PM | Cytosol | Nucleus | |||||
| Expt A |
18 peptides |
58 spectra |
|
0.000 0.000 | 0.000 |
0.000 0.000 | 0.000 |
0.000 0.000 | 0.000 |
0.000 0.000 | 0.000 |
0.000 0.000 | 0.000 |
0.000 0.000 | 0.000 |
0.841 0.836 | 0.845 |
0.159 0.155 | 0.164 |
| 2 spectra, FHASVR | 0.051 | 0.225 | 0.000 | 0.000 | 0.000 | 0.000 | 0.724 | 0.000 | ||
| 8 spectra, GAFETR | 0.000 | 0.000 | 0.000 | 0.000 | 0.000 | 0.000 | 0.914 | 0.086 | ||
| 6 spectra, GILLNWTK | 0.000 | 0.000 | 0.000 | 0.000 | 0.000 | 0.000 | 0.759 | 0.241 | ||
| 2 spectra, MVDESSANPGQQLYEK | 0.000 | 0.000 | 0.000 | 0.000 | 0.000 | 0.000 | 0.871 | 0.129 | ||
| 3 spectra, LTPNCEITFIESEEGSGR | 0.000 | 0.000 | 0.000 | 0.000 | 0.000 | 0.000 | 0.781 | 0.219 | ||
| 2 spectra, AAHMCSAGLAGVINR | 0.000 | 0.000 | 0.000 | 0.000 | 0.000 | 0.000 | 0.768 | 0.232 | ||
| 2 spectra, FVSQVESDSGDR | 0.000 | 0.000 | 0.000 | 0.000 | 0.000 | 0.000 | 0.862 | 0.138 | ||
| 3 spectra, LETHEEASVK | 0.000 | 0.000 | 0.000 | 0.000 | 0.000 | 0.000 | 0.822 | 0.178 | ||
| 3 spectra, GAALVSAVACK | 0.000 | 0.000 | 0.000 | 0.000 | 0.000 | 0.000 | 0.785 | 0.215 | ||
| 6 spectra, MLPTYVR | 0.000 | 0.000 | 0.000 | 0.000 | 0.000 | 0.000 | 0.925 | 0.075 | ||
| 1 spectrum, LVDENLLFHGEASEQLR | 0.000 | 0.000 | 0.000 | 0.000 | 0.000 | 0.000 | 0.737 | 0.263 | ||
| 3 spectra, YMGELVR | 0.000 | 0.000 | 0.000 | 0.000 | 0.000 | 0.000 | 0.841 | 0.159 | ||
| 3 spectra, SEDVMR | 0.000 | 0.000 | 0.000 | 0.000 | 0.000 | 0.000 | 0.851 | 0.149 | ||
| 3 spectra, ASGAEGNNIVGLLR | 0.000 | 0.000 | 0.000 | 0.000 | 0.000 | 0.000 | 0.760 | 0.240 | ||
| 4 spectra, ACESVSTR | 0.000 | 0.000 | 0.000 | 0.000 | 0.000 | 0.000 | 0.842 | 0.158 | ||
| 4 spectra, HEDLDK | 0.000 | 0.000 | 0.000 | 0.000 | 0.000 | 0.000 | 0.765 | 0.235 | ||
| 2 spectra, VGEGEAGQWSVK | 0.061 | 0.036 | 0.000 | 0.000 | 0.000 | 0.000 | 0.904 | 0.000 | ||
| 1 spectrum, ITVGVDGSVYK | 0.000 | 0.000 | 0.000 | 0.000 | 0.000 | 0.000 | 0.681 | 0.319 |
| Plot | Mito | Lyso or Perox | ER | Golgi | PM | Cytosol | Nucleus | ||||||
| Expt B |
4 peptides |
6 spectra |
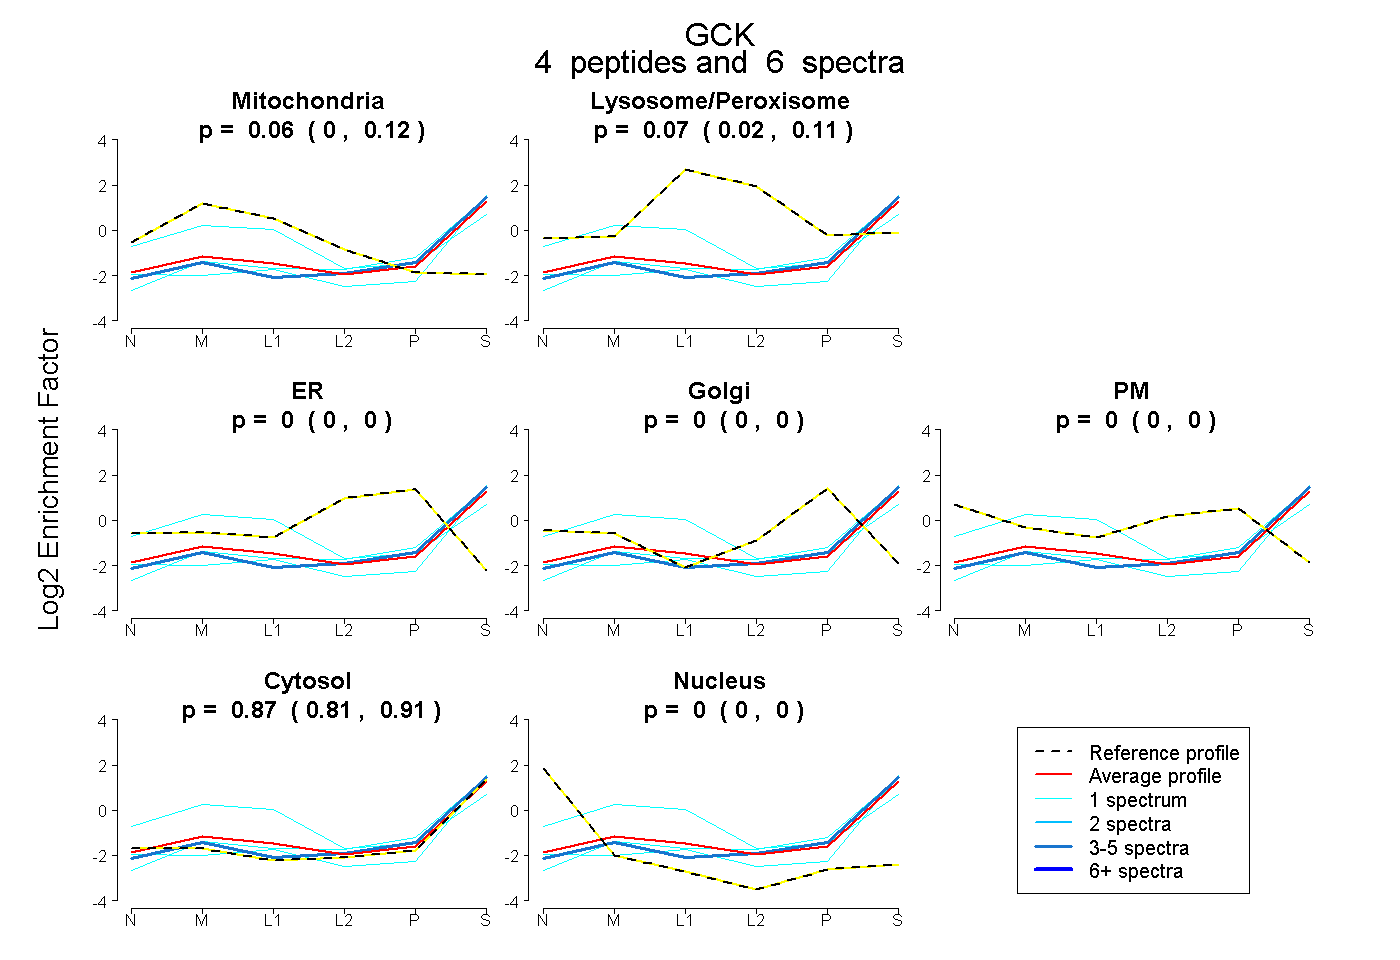 |
0.063 0.000 | 0.124 |
0.070 0.016 | 0.114 |
0.000 0.000 | 0.000 |
0.000 0.000 | 0.000 |
0.000 0.000 | 0.000 |
0.867 0.808 | 0.911 |
0.000 0.000 | 0.000 |
|||
| Plot | Lyso | Other | |||||||||||
| Expt C |
7 peptides |
22 spectra |
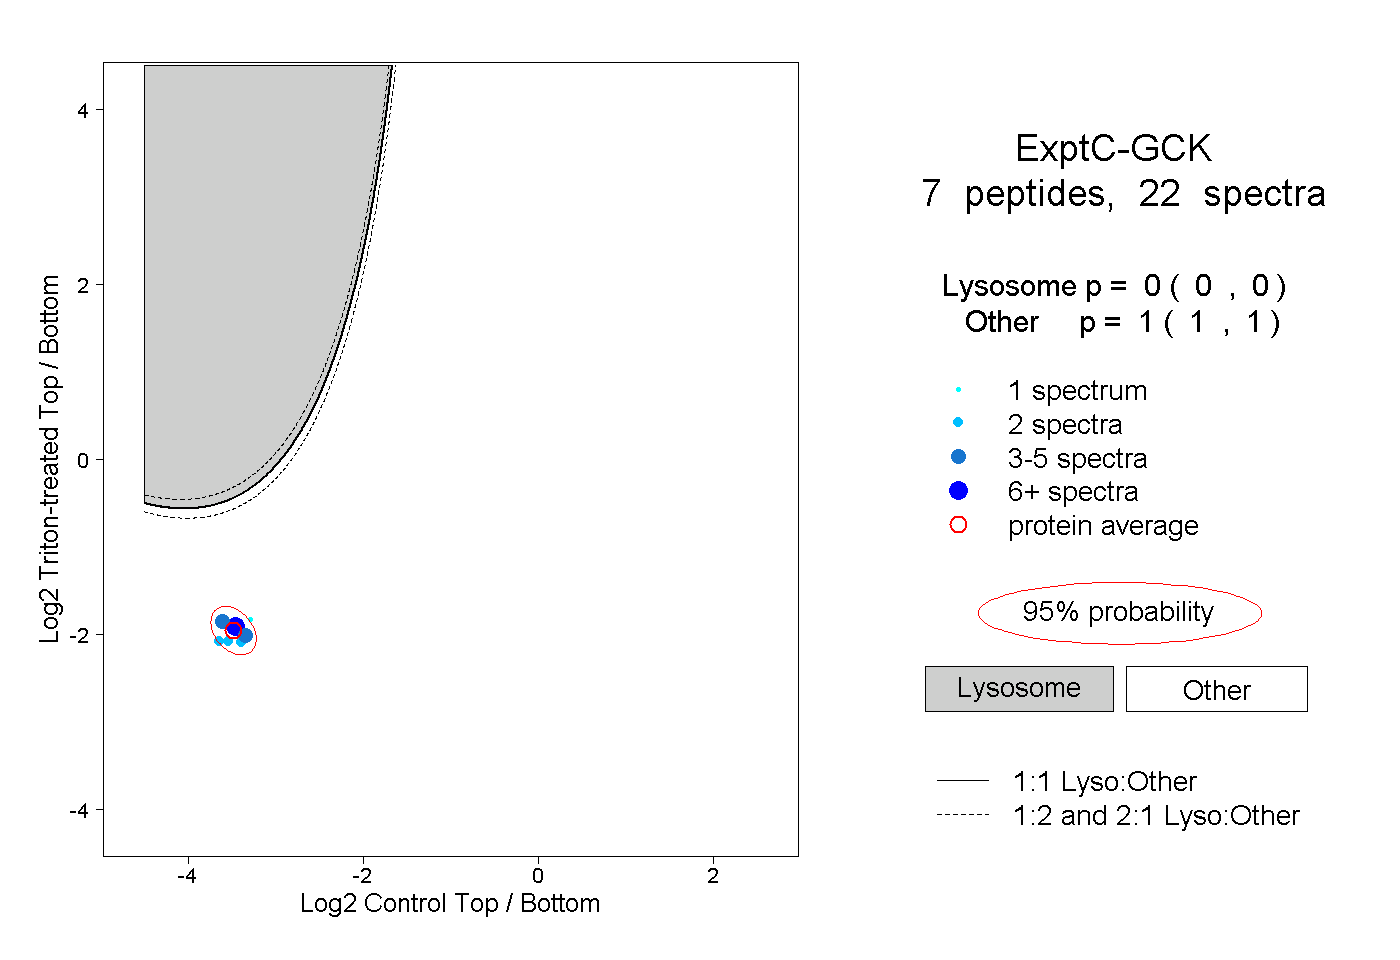 |
0.000 0.000 | 0.000 |
1.000 1.000 | 1.000 |