 3
3peptides
spectra
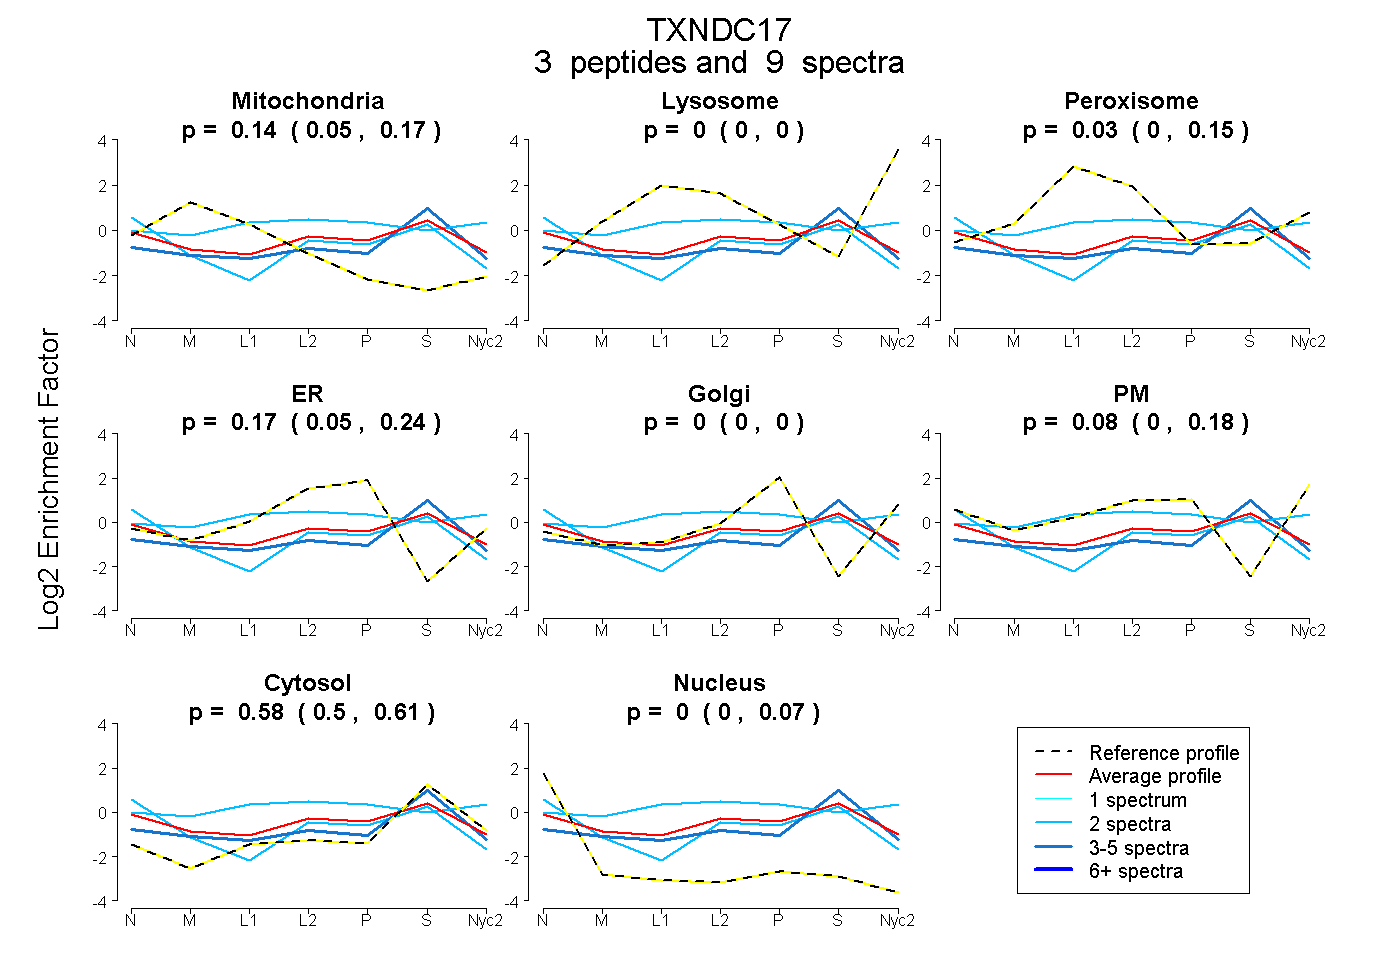
0.054 | 0.170
0.000 | 0.000
0.000 | 0.153
0.046 | 0.243
0.000 | 0.000
0.000 | 0.178
0.497 | 0.611
0.000 | 0.069
2peptides
spectra
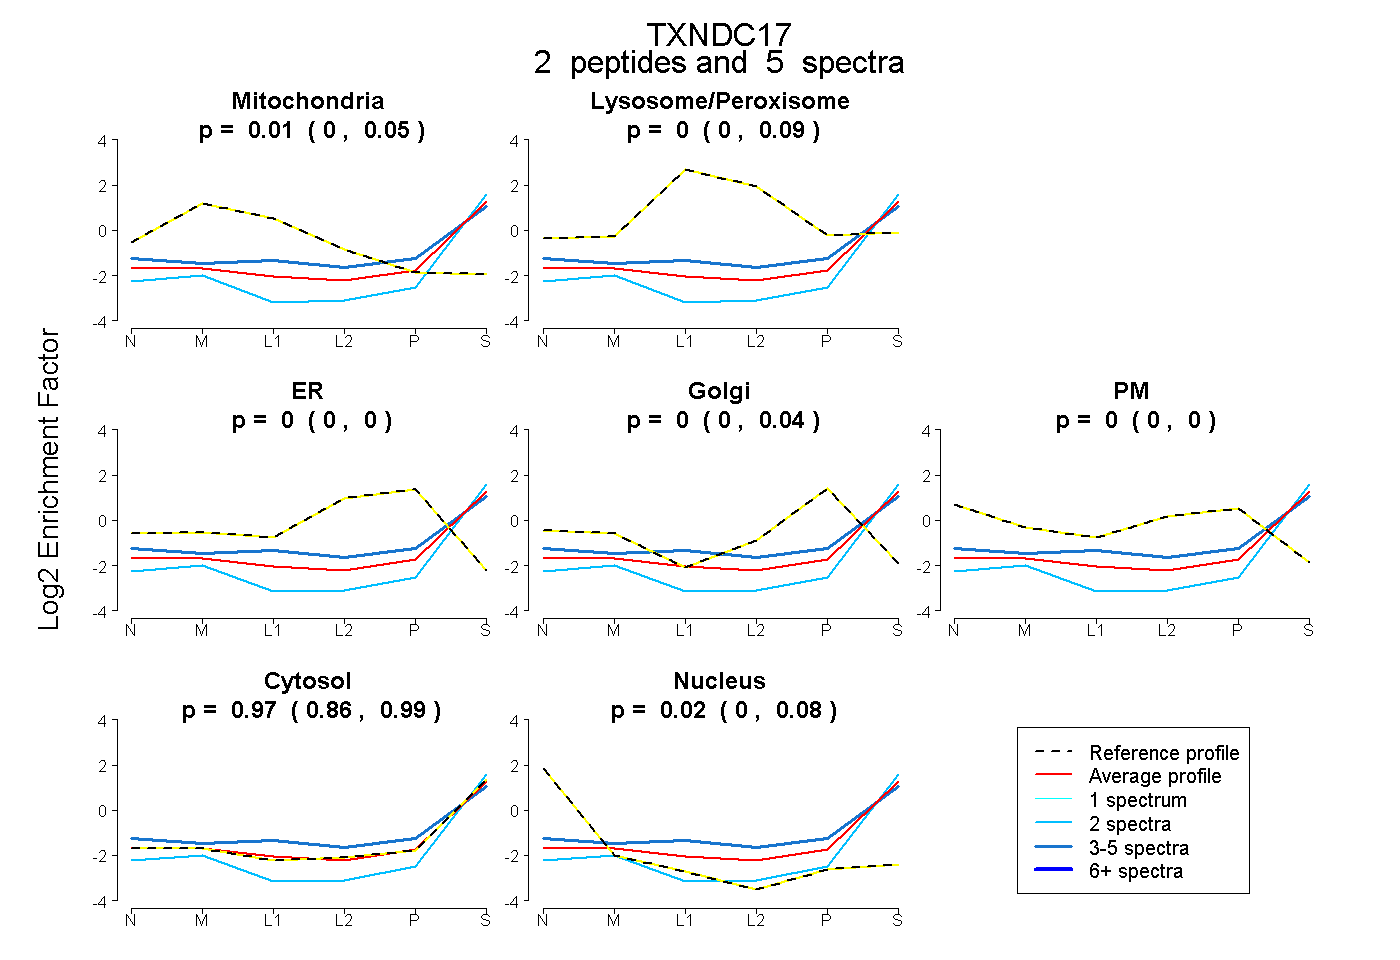
0.000 | 0.051
0.000 | 0.094
0.000 | 0.000
0.000 | 0.042
0.000 | 0.000
0.860 | 0.993
0.000 | 0.078
4peptides
spectra
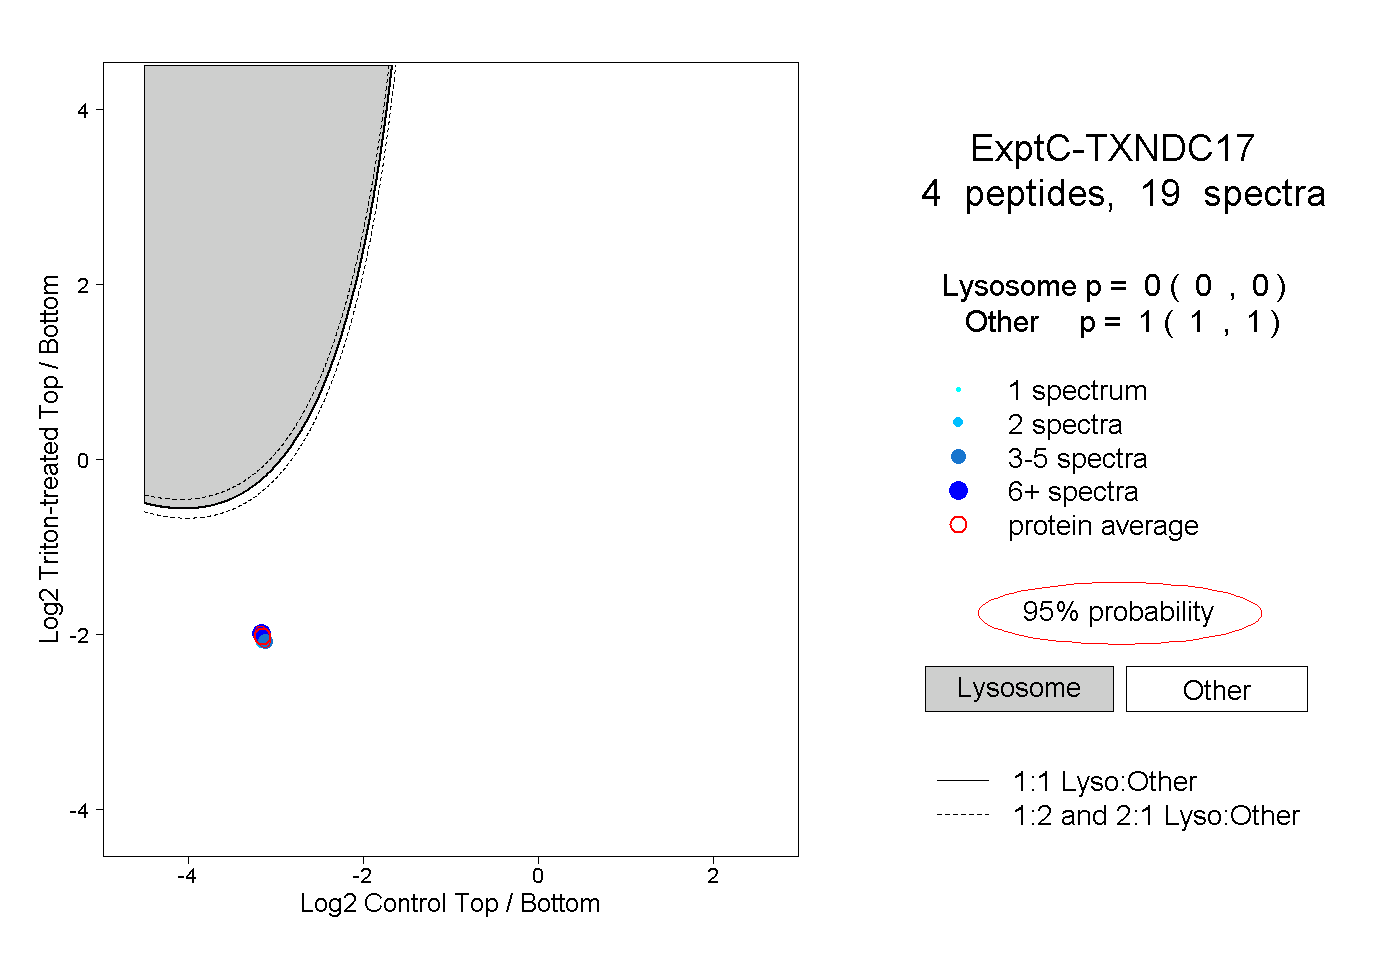
0.000 | 0.000
1.000 | 1.000
1peptide
spectra
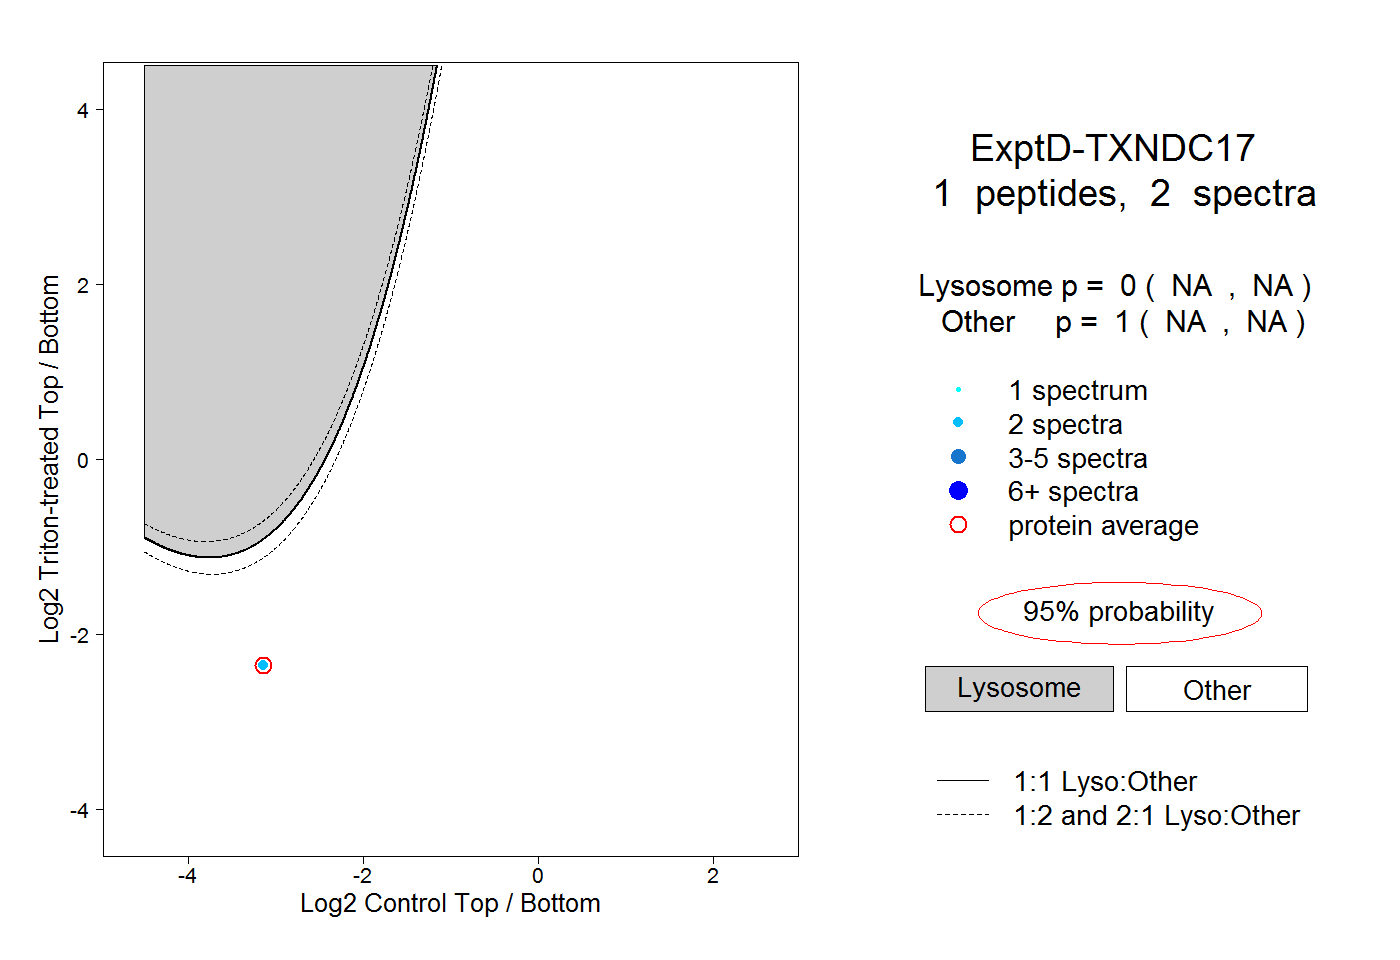
NA | NA
NA | NA