 3
3peptides
spectra
0.054 | 0.170
0.000 | 0.000
0.000 | 0.153
0.046 | 0.243
0.000 | 0.000
0.000 | 0.178
0.497 | 0.611
0.000 | 0.069
| Plot | Mito | Lyso | Perox | ER | Golgi | PM | Cytosol | Nucleus | |||||
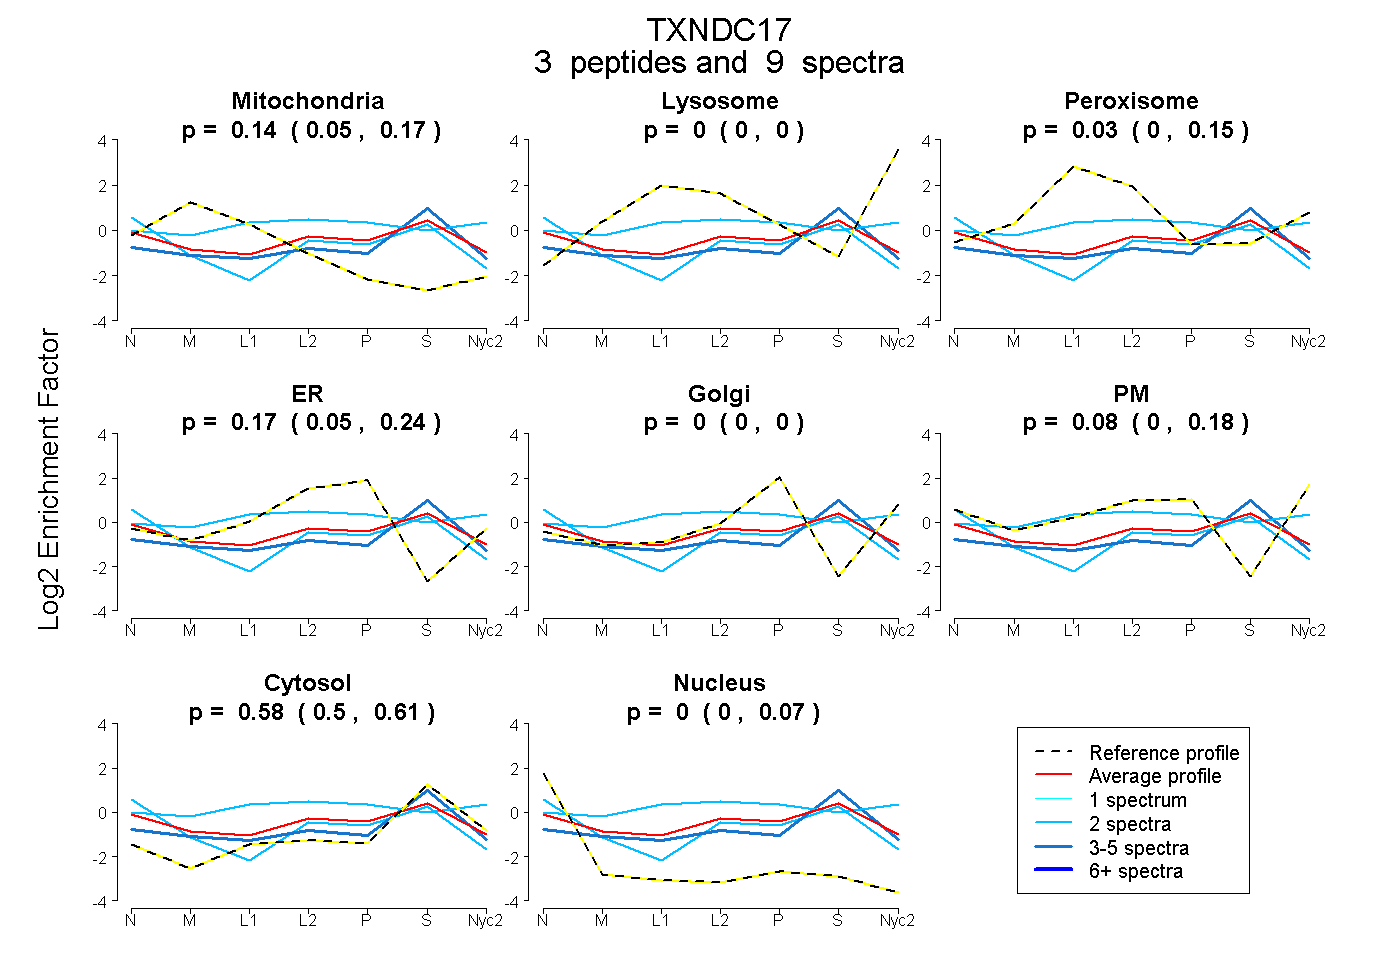
| Expt A |
3 peptides |
9 spectra |
|
0.138 0.054 | 0.170 |
0.000 0.000 | 0.000 |
0.031 0.000 | 0.153 |
0.167 0.046 | 0.243 |
0.000 0.000 | 0.000 |
0.081 0.000 | 0.178 |
0.578 0.497 | 0.611 |
0.005 0.000 | 0.069 |
| 2 spectra, SWCPDCVEAEPIIR | 0.000 | 0.000 | 0.367 | 0.000 | 0.135 | 0.216 | 0.282 | 0.000 | ||
| 2 spectra, ITAVPTLLK | 0.025 | 0.000 | 0.000 | 0.225 | 0.000 | 0.021 | 0.512 | 0.216 | ||
| 5 spectra, LVESECR | 0.169 | 0.000 | 0.033 | 0.045 | 0.000 | 0.000 | 0.753 | 0.000 |
| Plot | Mito | Lyso or Perox | ER | Golgi | PM | Cytosol | Nucleus | ||||||
| Expt B |
2 peptides |
5 spectra |
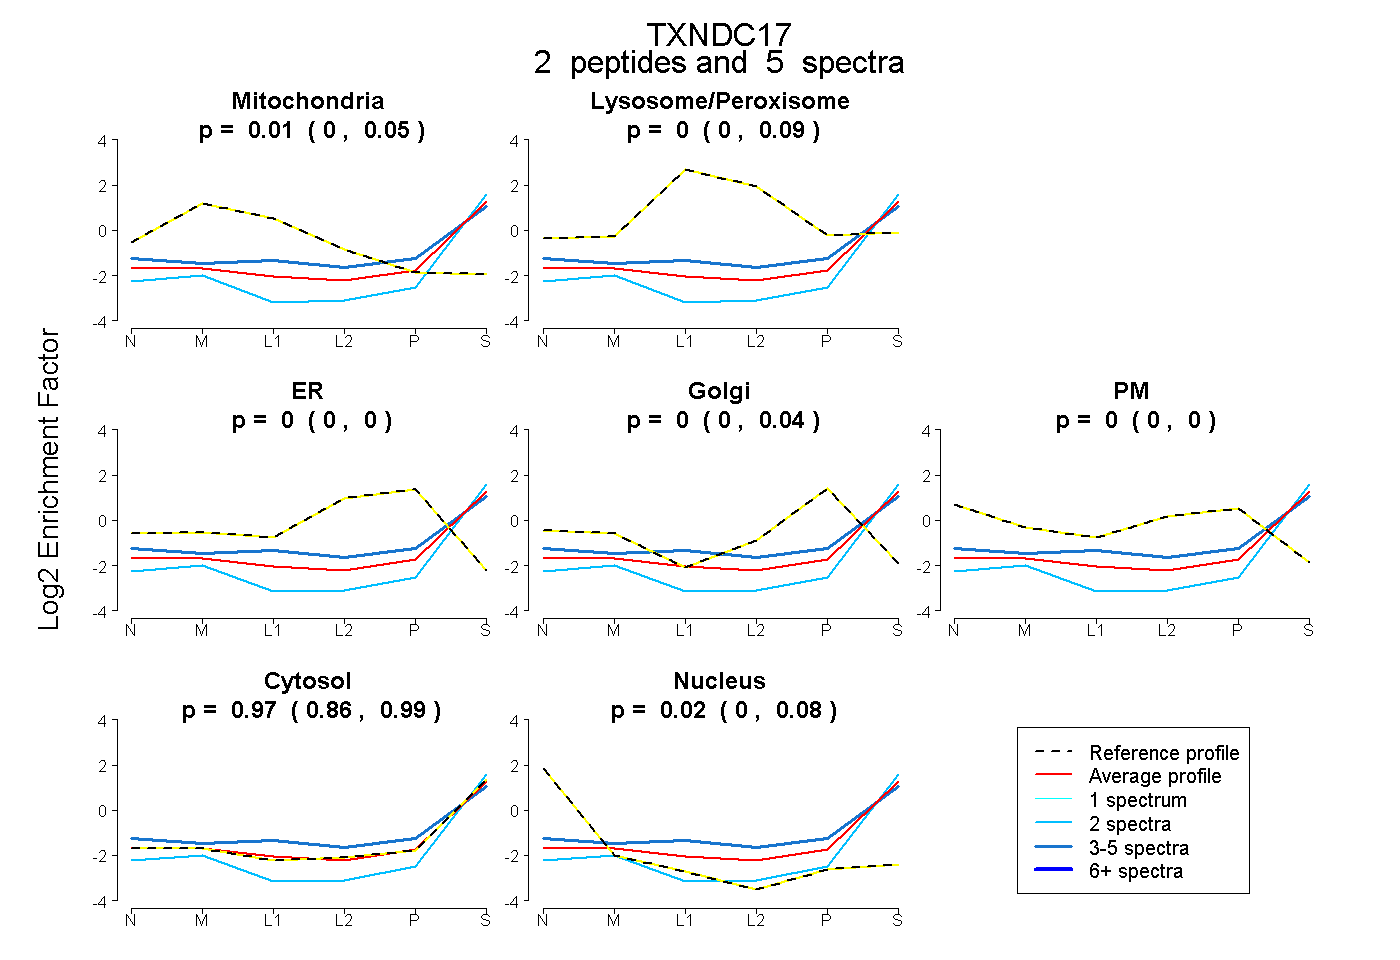 |
0.012 0.000 | 0.051 |
0.002 0.000 | 0.094 |
0.000 0.000 | 0.000 |
0.000 0.000 | 0.042 |
0.000 0.000 | 0.000 |
0.967 0.860 | 0.993 |
0.019 0.000 | 0.078 |
|||
| Plot | Lyso | Other | |||||||||||
| Expt C |
4 peptides |
19 spectra |
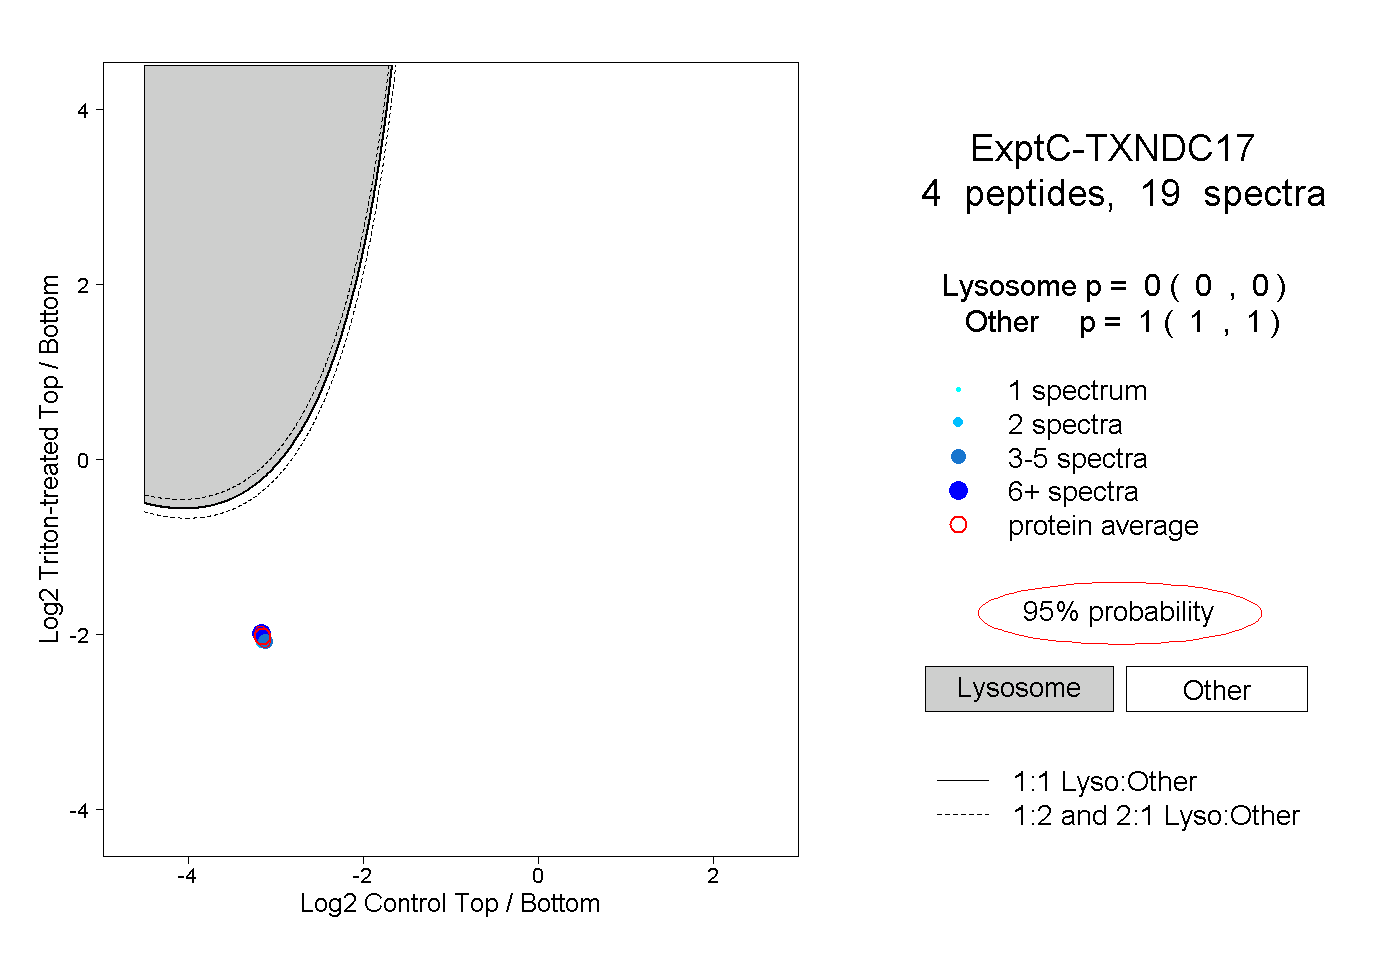 |
0.000 0.000 | 0.000 |
1.000 1.000 | 1.000 |
||||||||
| Plot | Lyso | Other | |||||||||||
| Expt D |
1 peptide |
2 spectra |
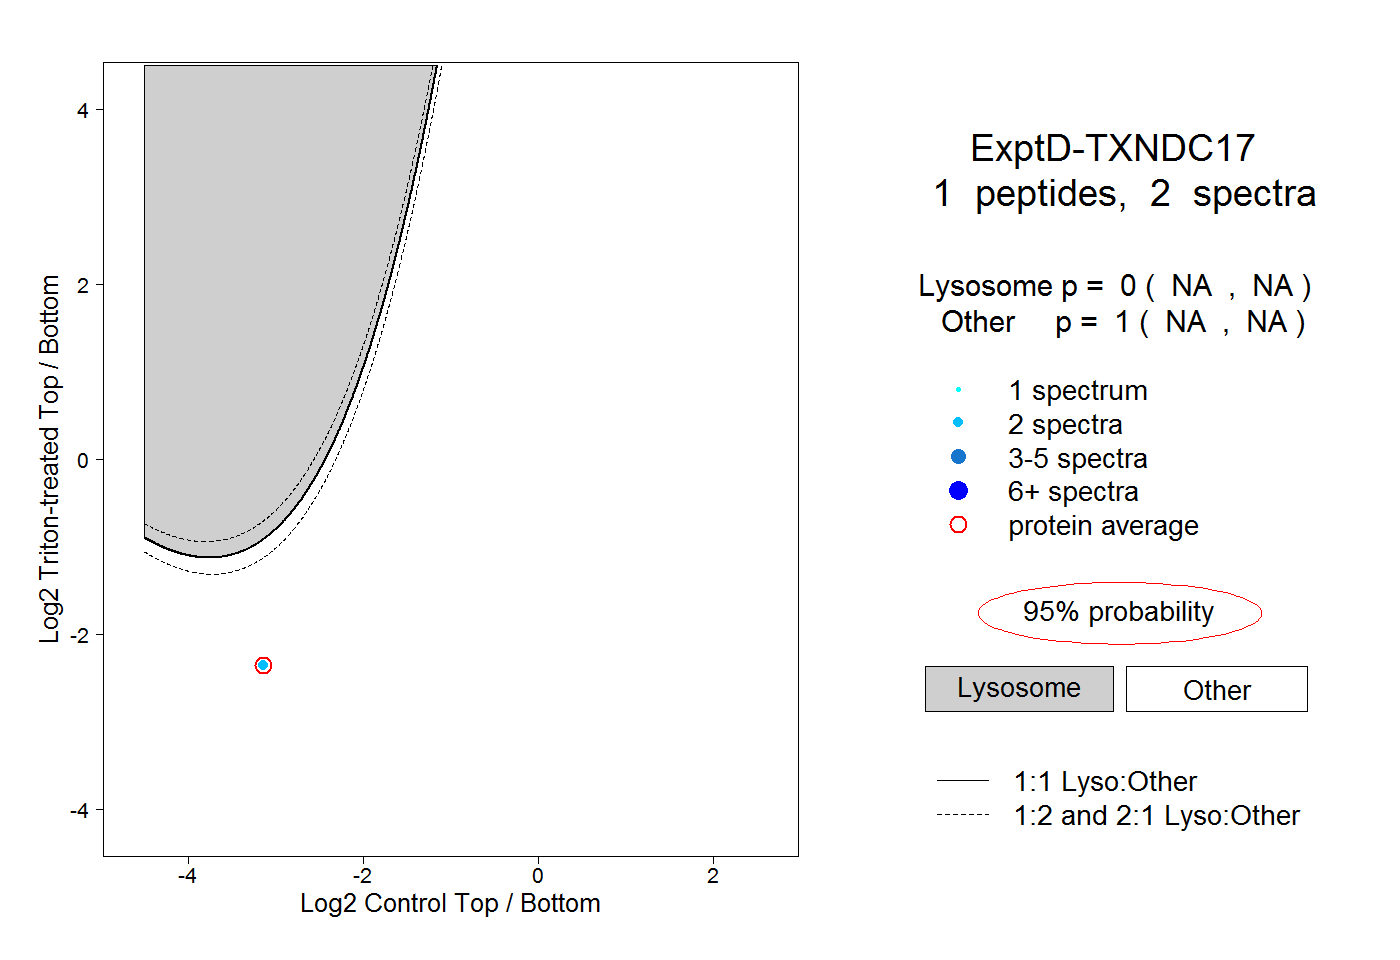 |
0.000 NA | NA |
1.000 NA | NA |