 3
3peptides
spectra
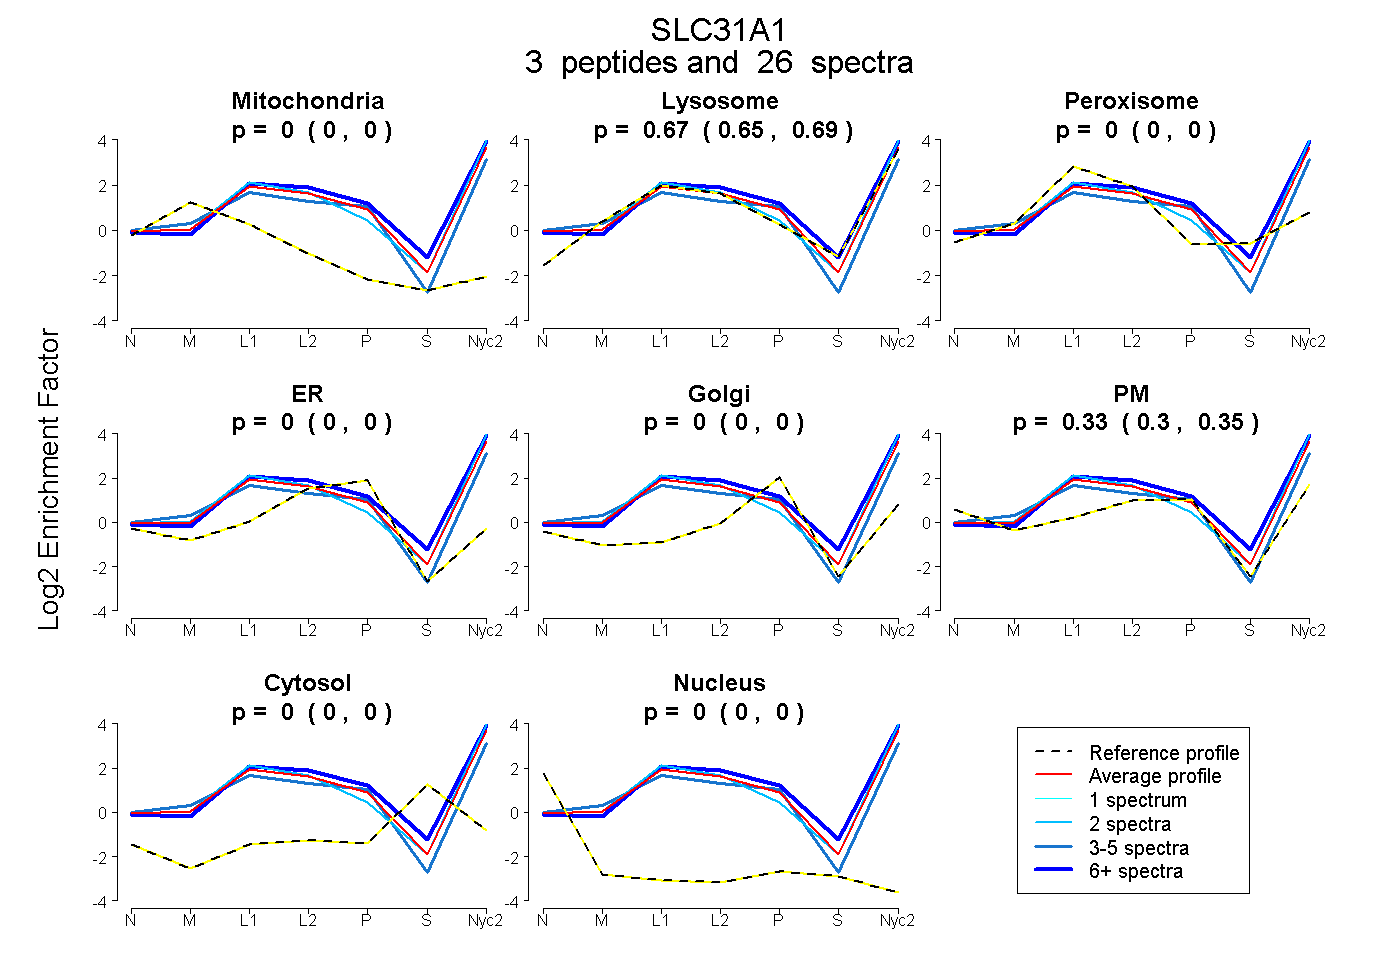
0.000 | 0.000
0.650 | 0.693
0.000 | 0.000
0.000 | 0.000
0.000 | 0.000
0.303 | 0.346
0.000 | 0.000
0.000 | 0.000
1peptide
spectra
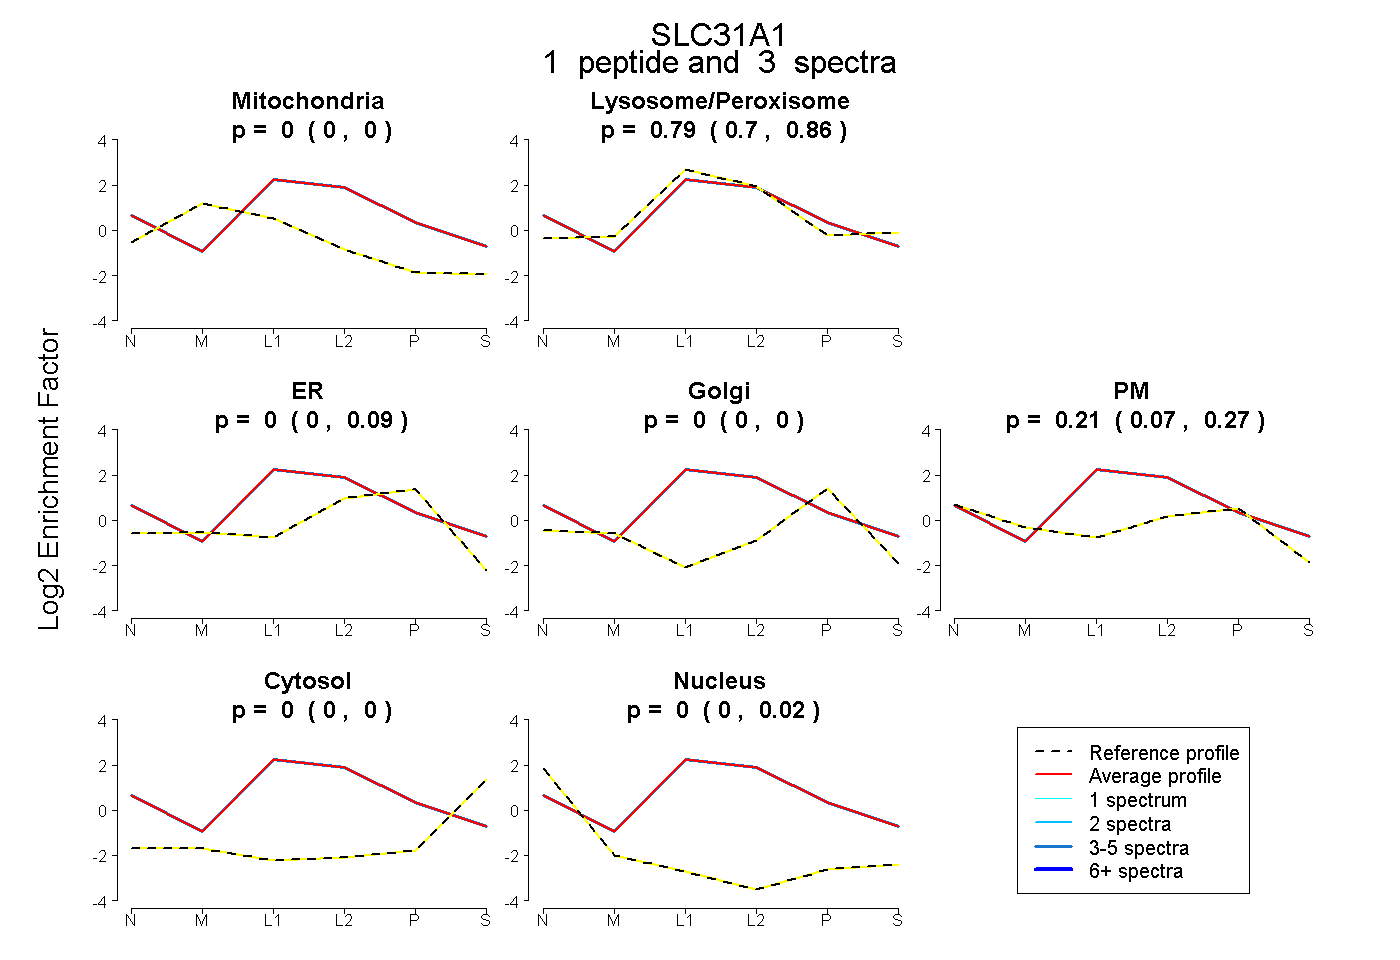
0.000 | 0.000
0.702 | 0.864
0.000 | 0.089
0.000 | 0.000
0.070 | 0.274
0.000 | 0.000
0.000 | 0.016
3peptides
spectra
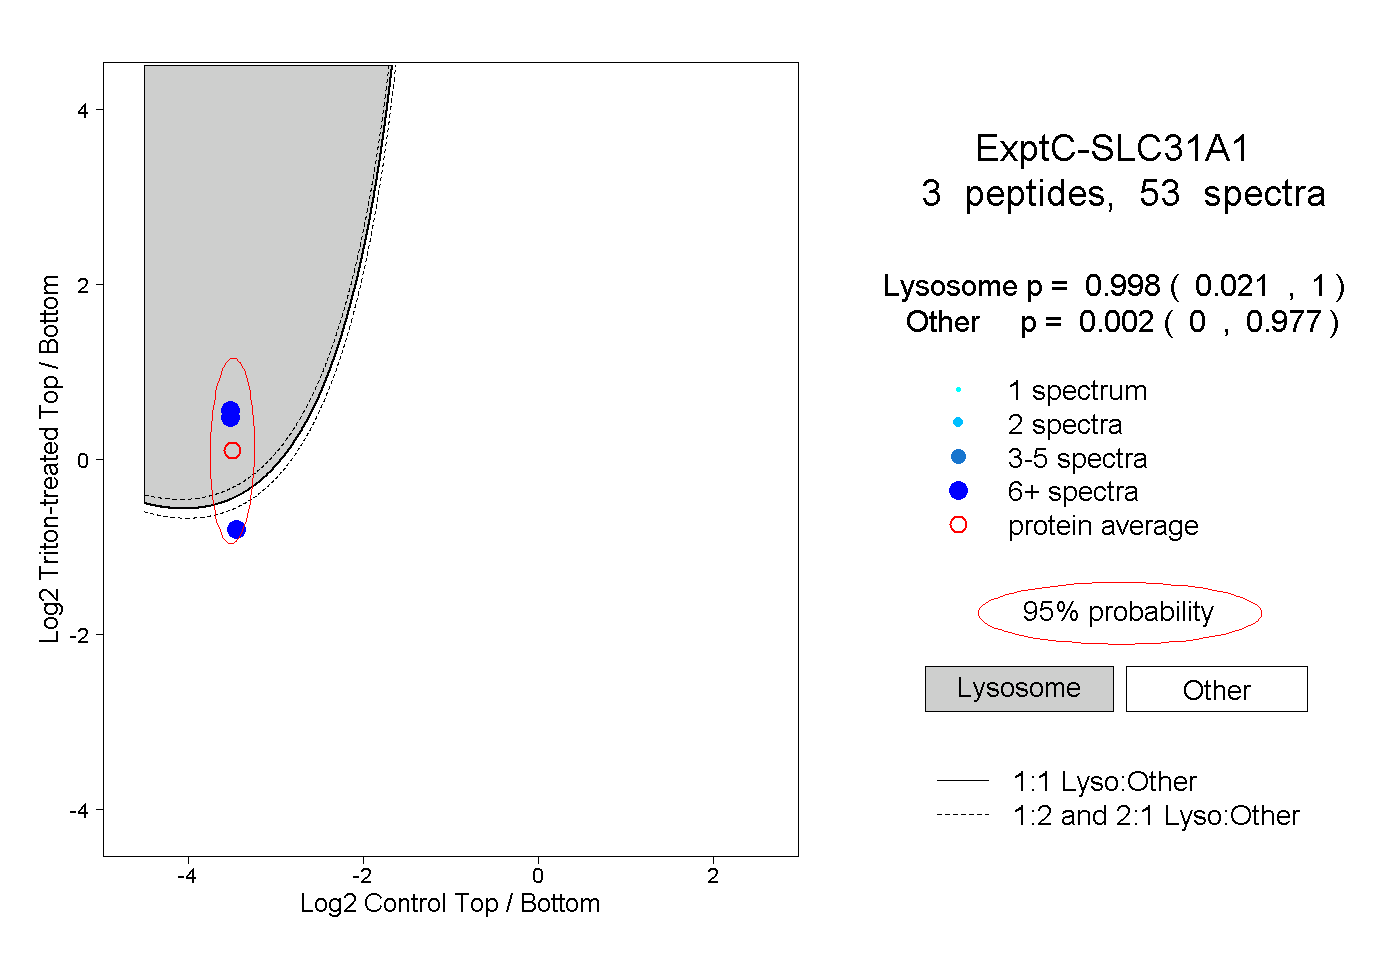
0.021 | 1.000
0.000 | 0.977
1peptide
spectrum
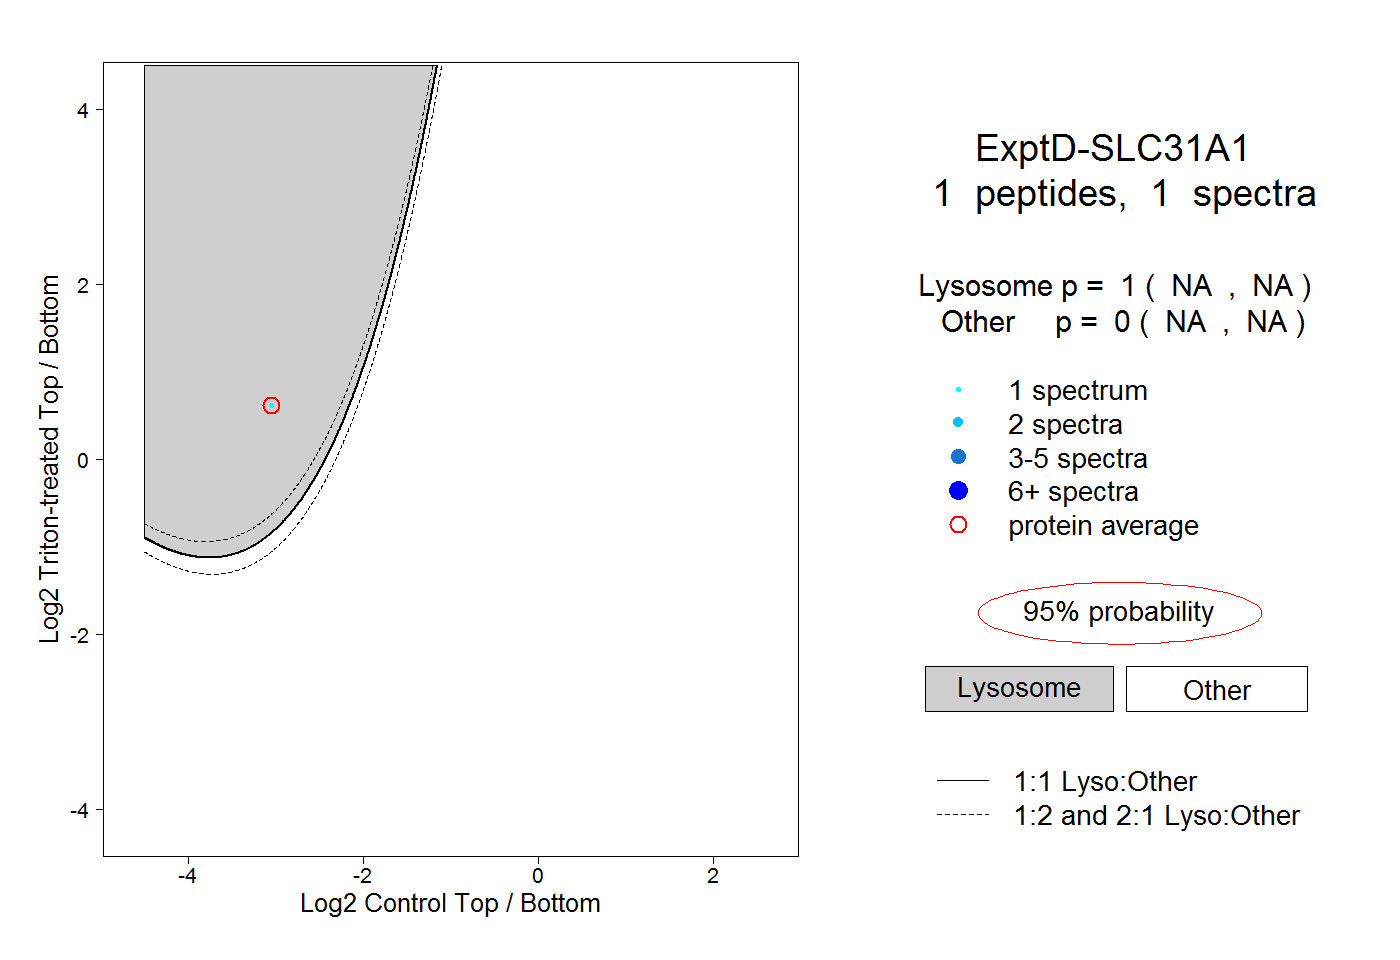
NA | NA
NA | NA