 3
3peptides
spectra
0.000 | 0.000
0.650 | 0.693
0.000 | 0.000
0.000 | 0.000
0.000 | 0.000
0.303 | 0.346
0.000 | 0.000
0.000 | 0.000
| Plot | Mito | Lyso | Perox | ER | Golgi | PM | Cytosol | Nucleus | |||||
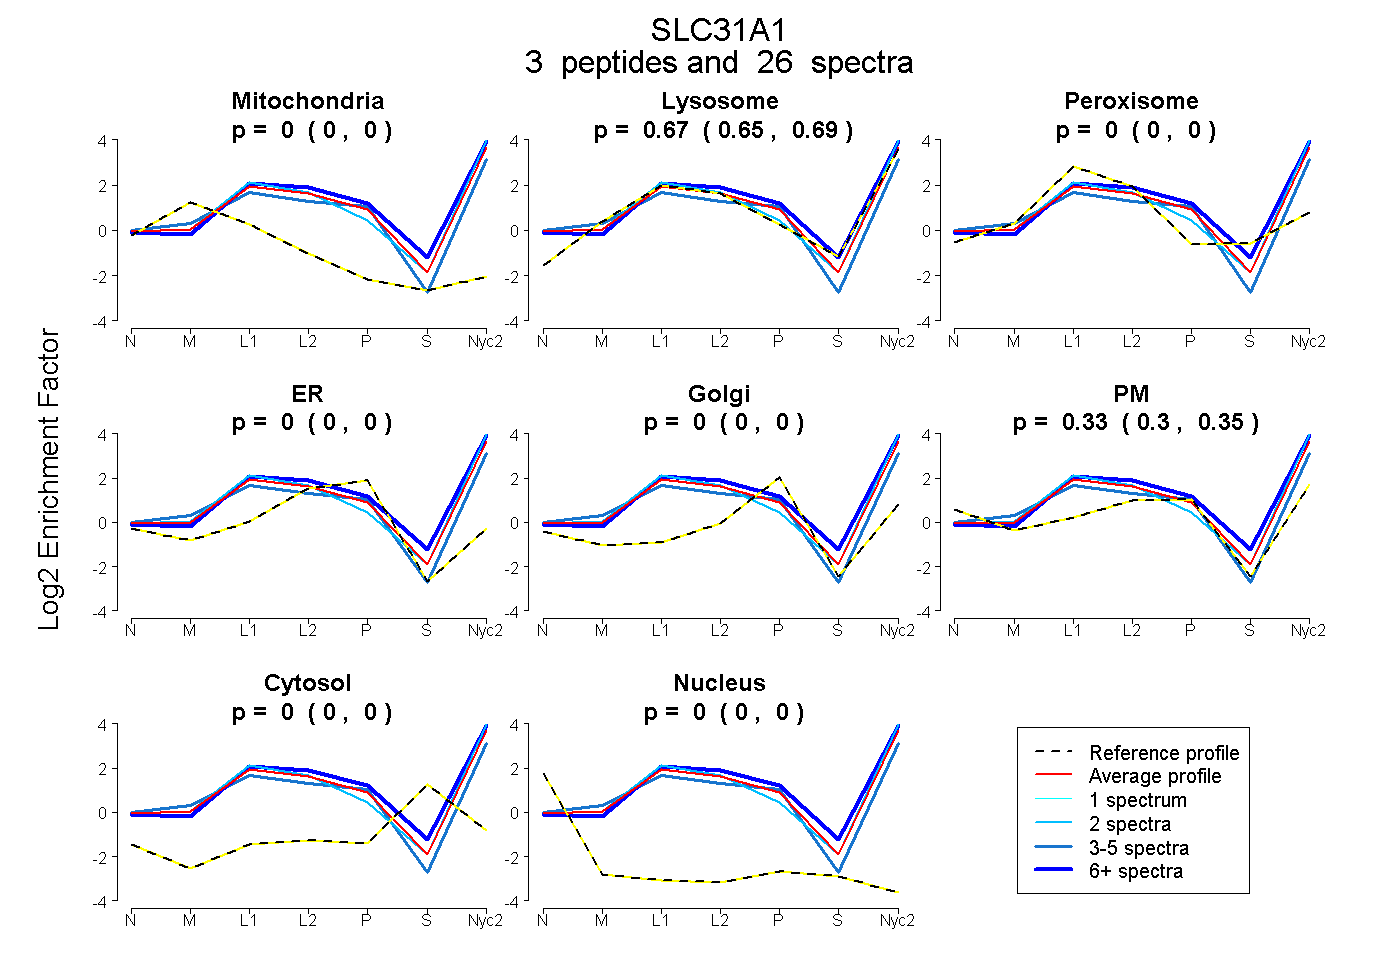
| Expt A |
3 peptides |
26 spectra |
|
0.000 0.000 | 0.000 |
0.673 0.650 | 0.693 |
0.000 0.000 | 0.000 |
0.000 0.000 | 0.000 |
0.000 0.000 | 0.000 |
0.327 0.303 | 0.346 |
0.000 0.000 | 0.000 |
0.000 0.000 | 0.000 |
| 2 spectra, YNSMPVPGPNGTILMETHK | 0.000 | 0.755 | 0.000 | 0.000 | 0.000 | 0.245 | 0.000 | 0.000 | ||
| 5 spectra, AVVVDITEHCH | 0.000 | 0.470 | 0.000 | 0.000 | 0.000 | 0.530 | 0.000 | 0.000 | ||
| 19 spectra, SQVSIR | 0.000 | 0.772 | 0.000 | 0.000 | 0.000 | 0.228 | 0.000 | 0.000 |
| Plot | Mito | Lyso or Perox | ER | Golgi | PM | Cytosol | Nucleus | ||||||
| Expt B |
1 peptide |
3 spectra |
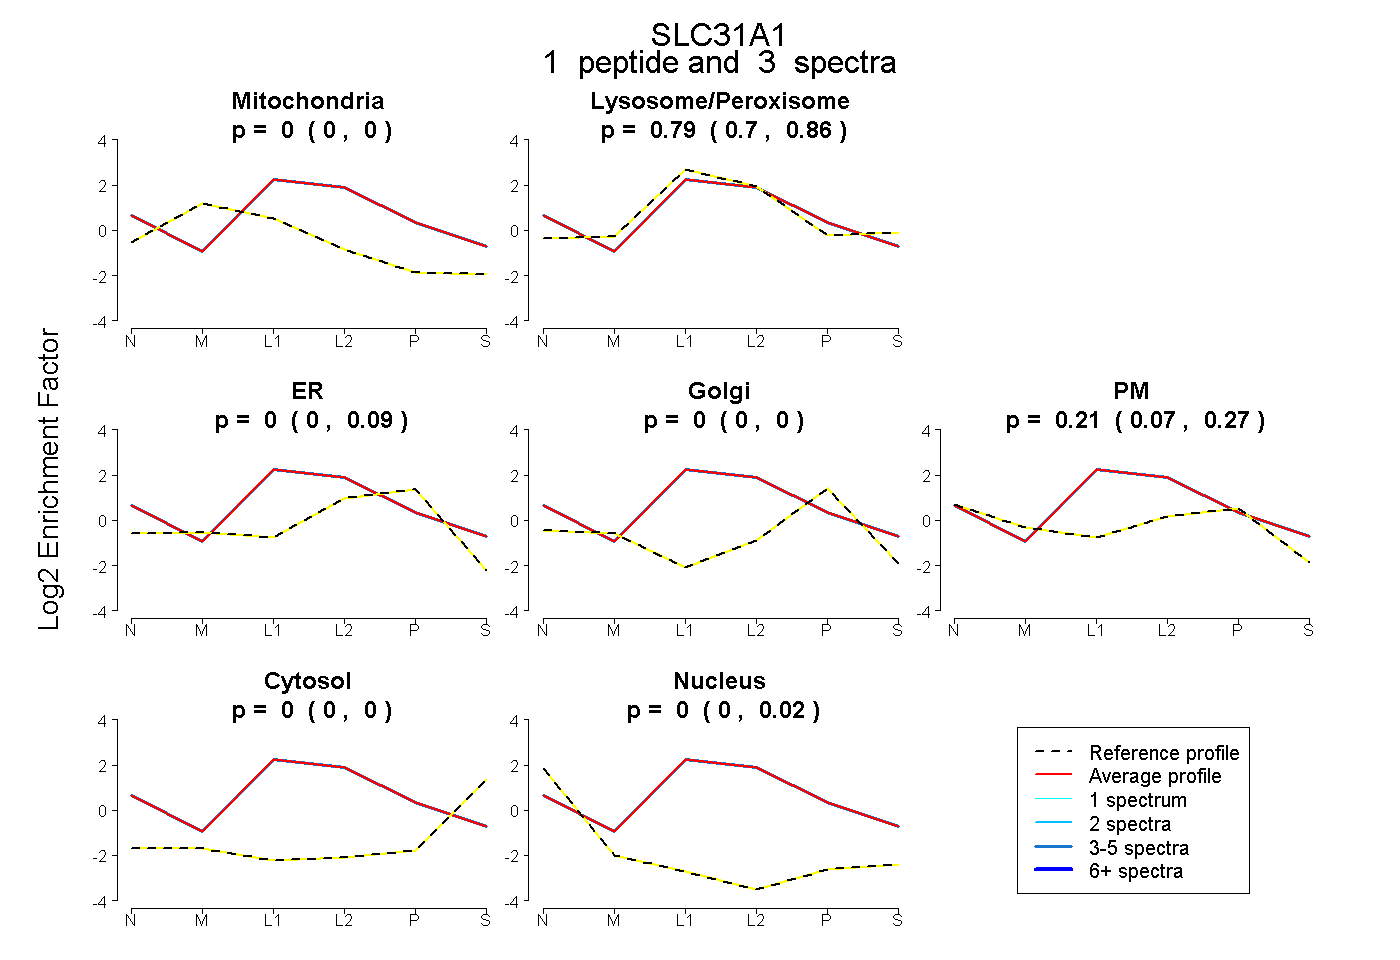 |
0.000 0.000 | 0.000 |
0.786 0.702 | 0.864 |
0.000 0.000 | 0.089 |
0.000 0.000 | 0.000 |
0.214 0.070 | 0.274 |
0.000 0.000 | 0.000 |
0.000 0.000 | 0.016 |
|||
| Plot | Lyso | Other | |||||||||||
| Expt C |
3 peptides |
53 spectra |
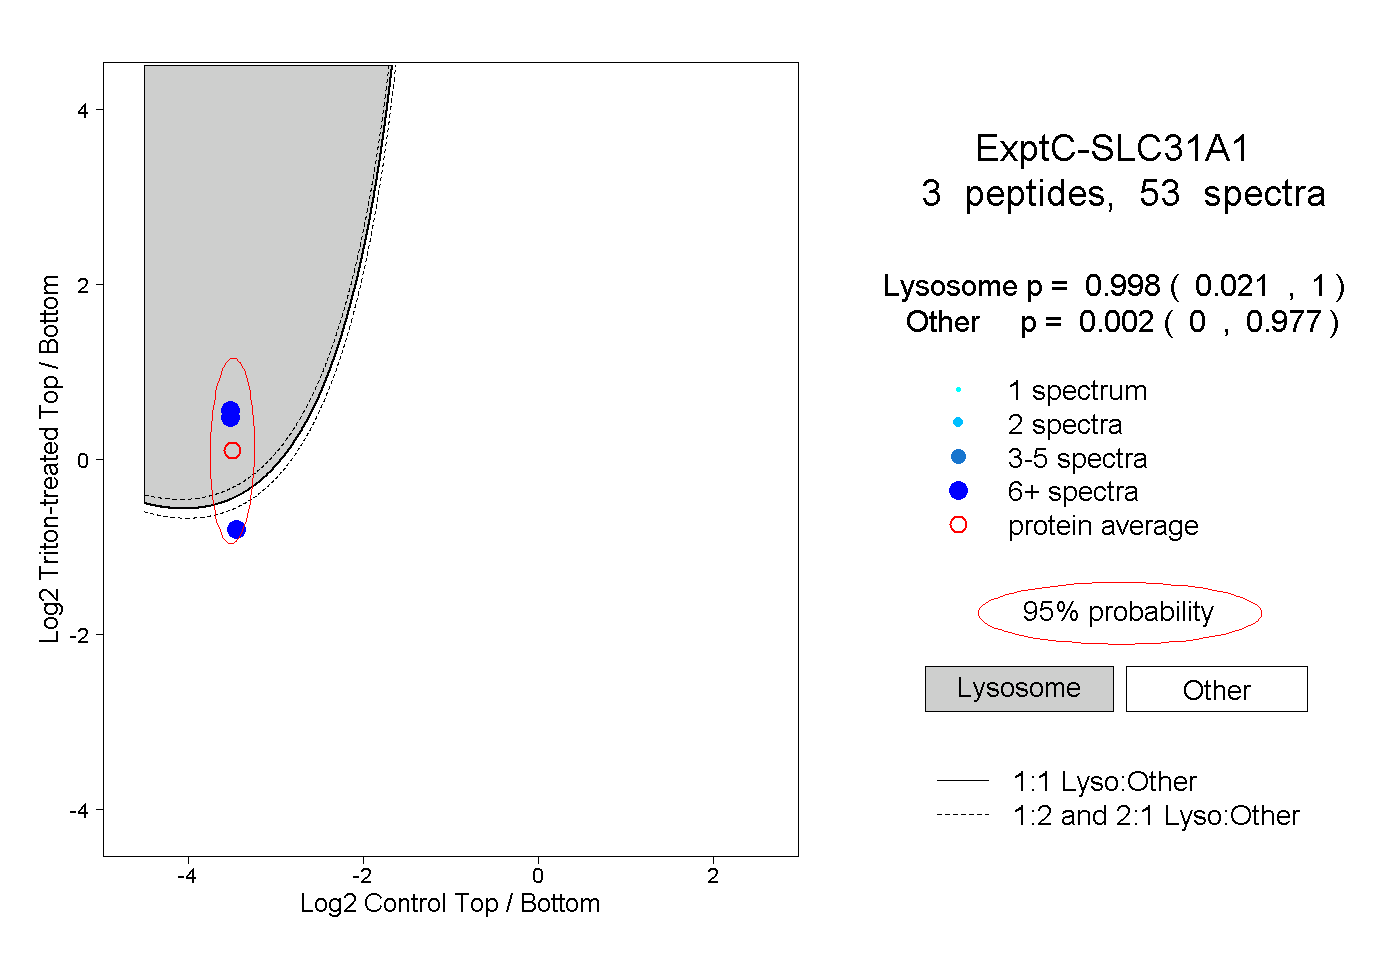 |
0.998 0.021 | 1.000 |
0.002 0.000 | 0.977 |
||||||||
| Plot | Lyso | Other | |||||||||||
| Expt D |
1 peptide |
1 spectrum |
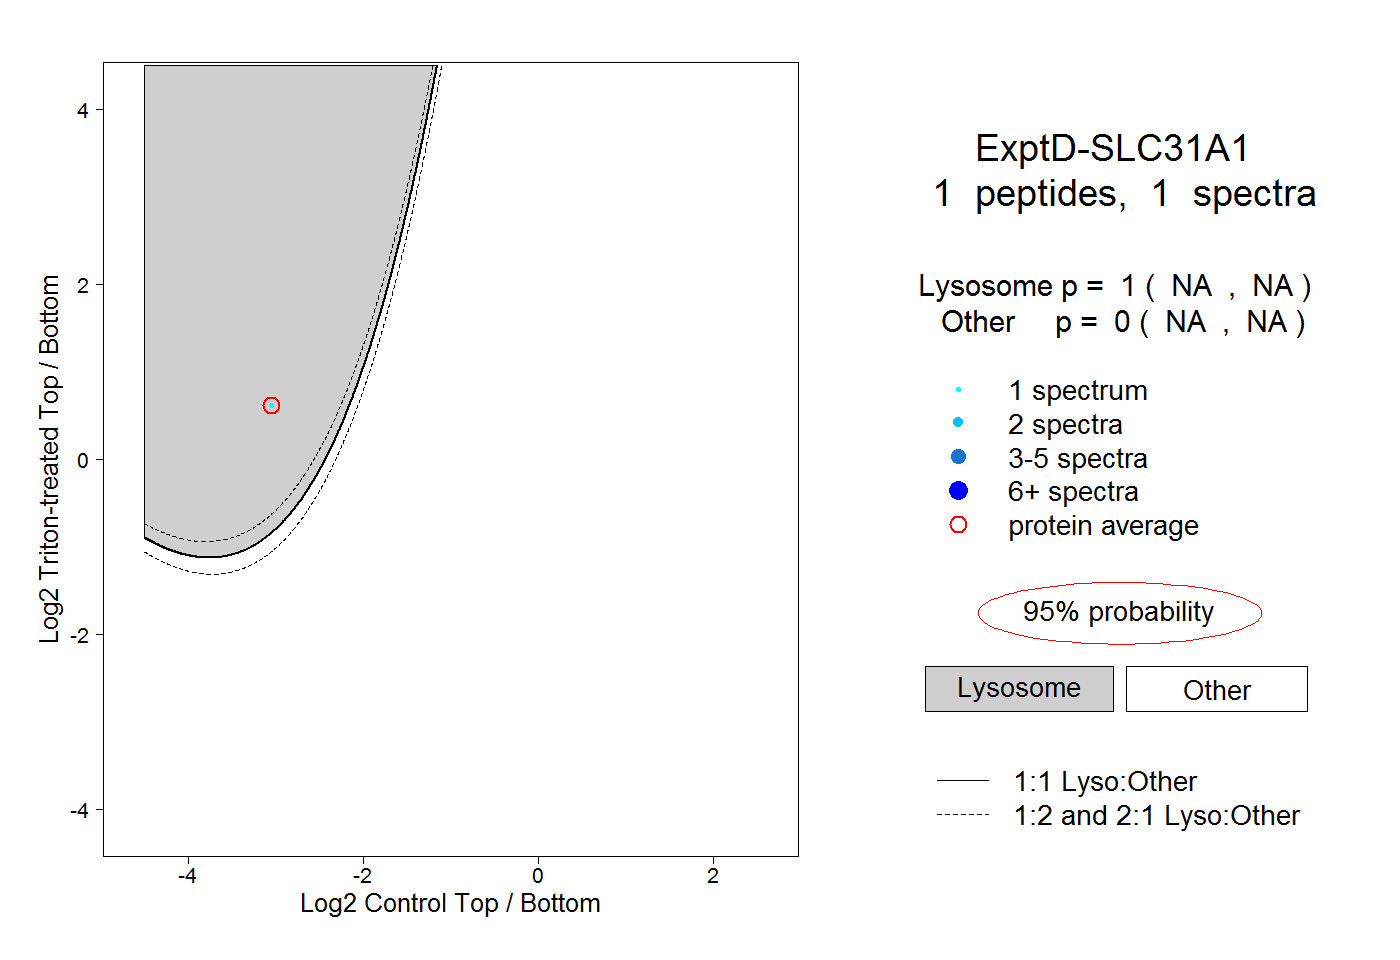 |
1.000 NA | NA |
0.000 NA | NA |