 27
27peptides
spectra
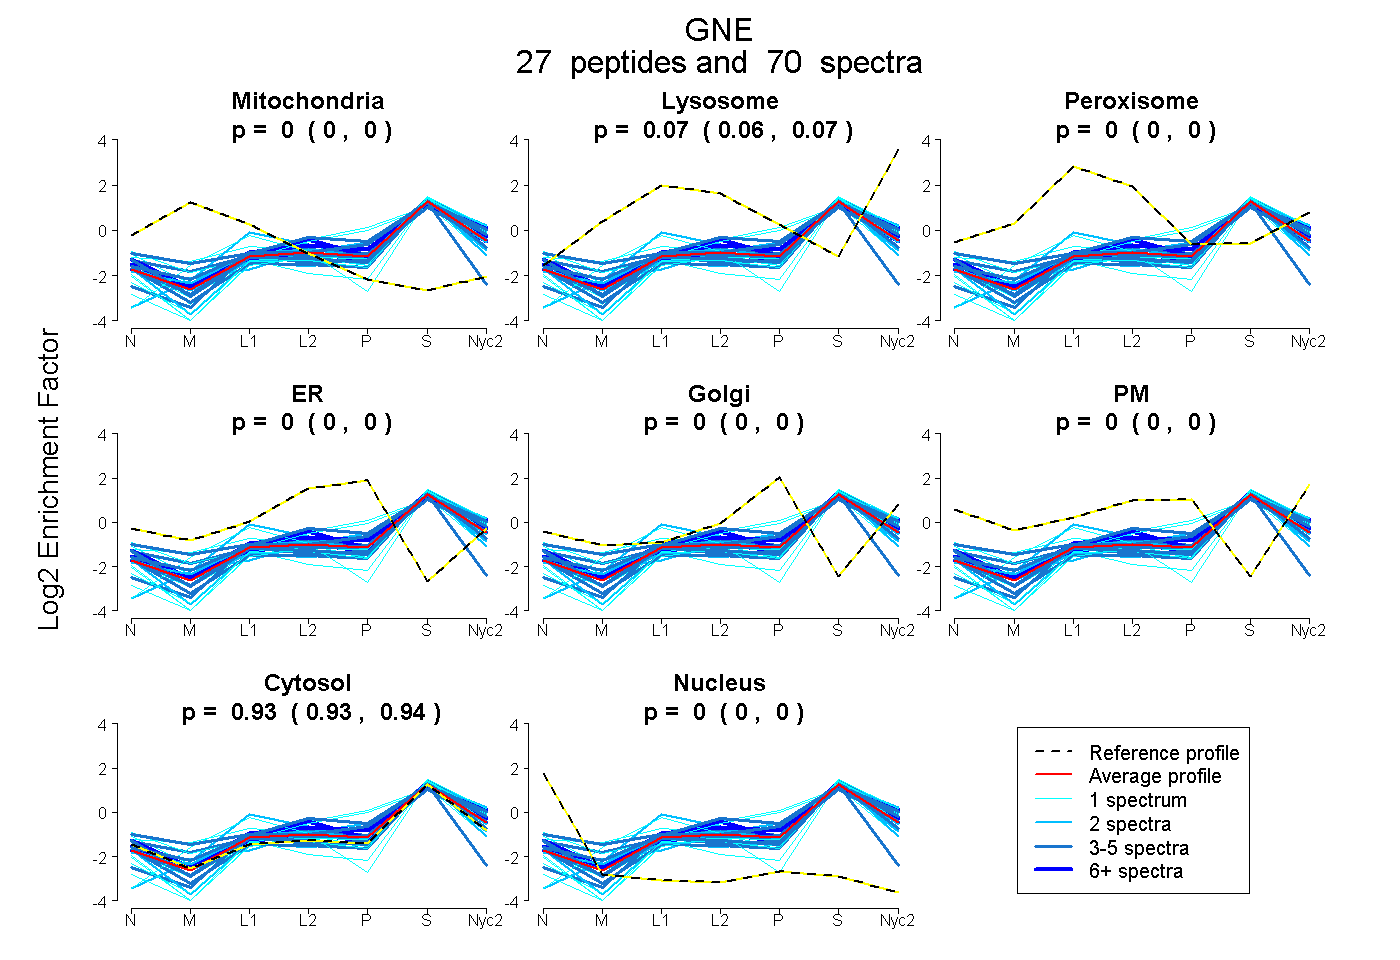
0.000 | 0.000
0.063 | 0.069
0.000 | 0.000
0.000 | 0.000
0.000 | 0.000
0.000 | 0.000
0.931 | 0.936
0.000 | 0.000
11peptides
spectra
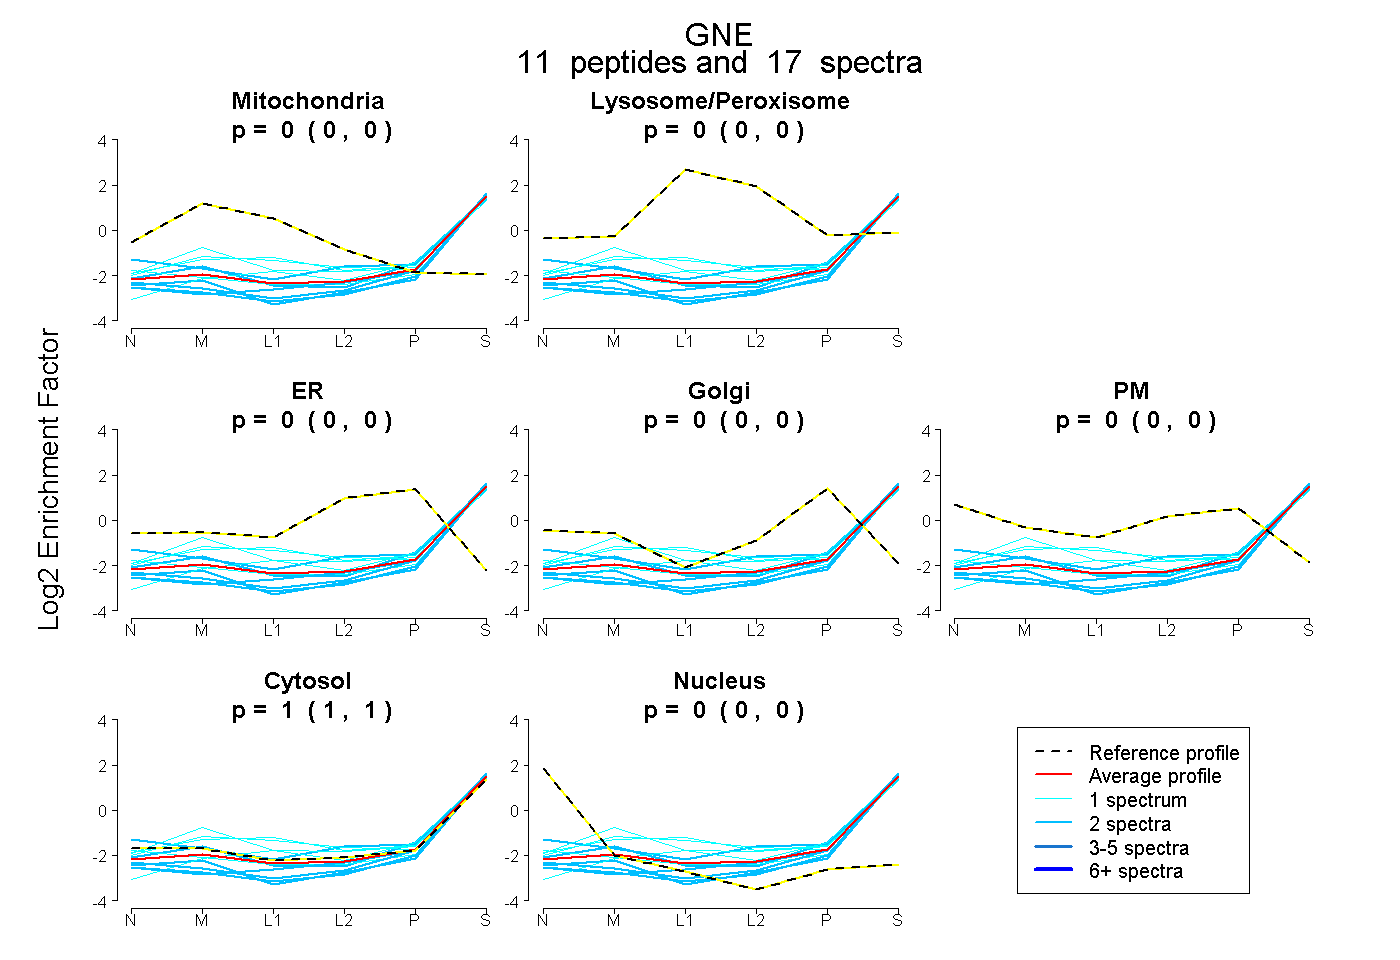
0.000 | 0.000
0.000 | 0.000
0.000 | 0.000
0.000 | 0.000
0.000 | 0.000
1.000 | 1.000
0.000 | 0.000
22peptides
spectra
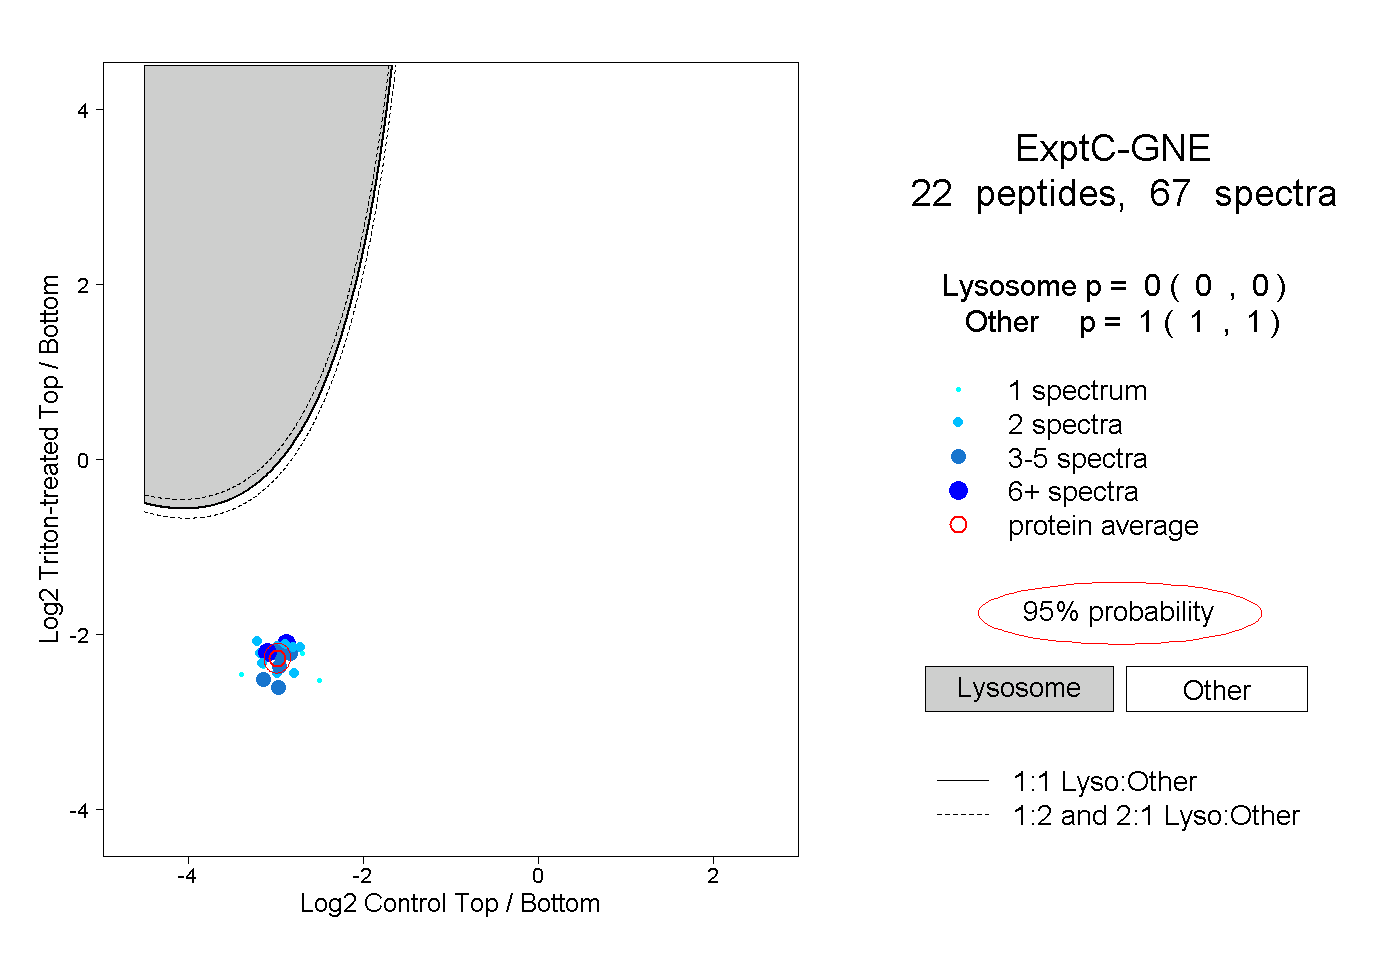
0.000 | 0.000
1.000 | 1.000
5peptides
spectra
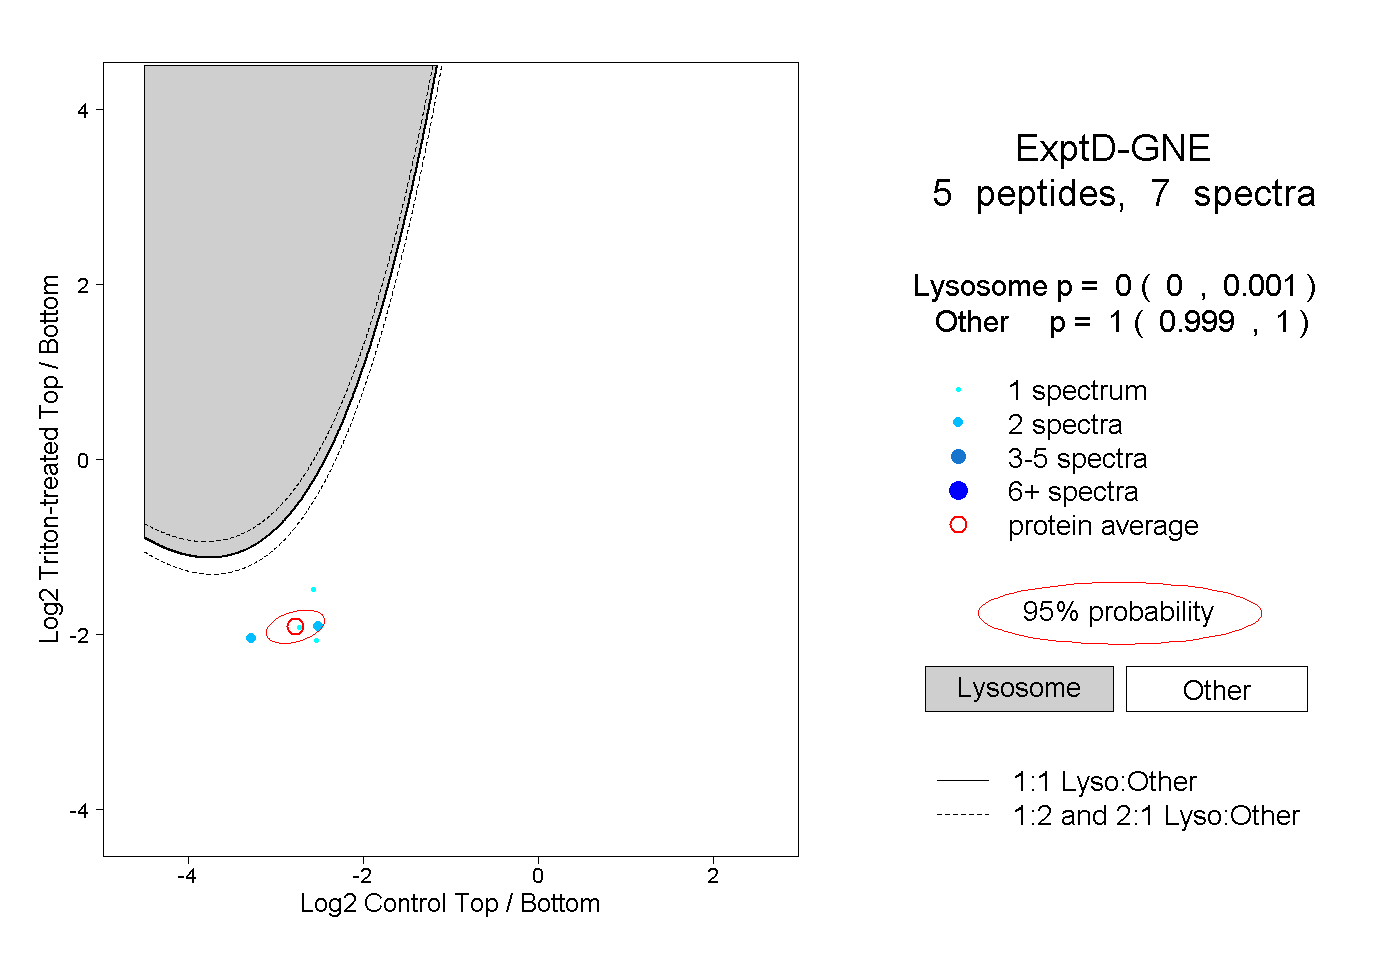
0.000 | 0.001
0.999 | 1.000