 24
24peptides
spectra
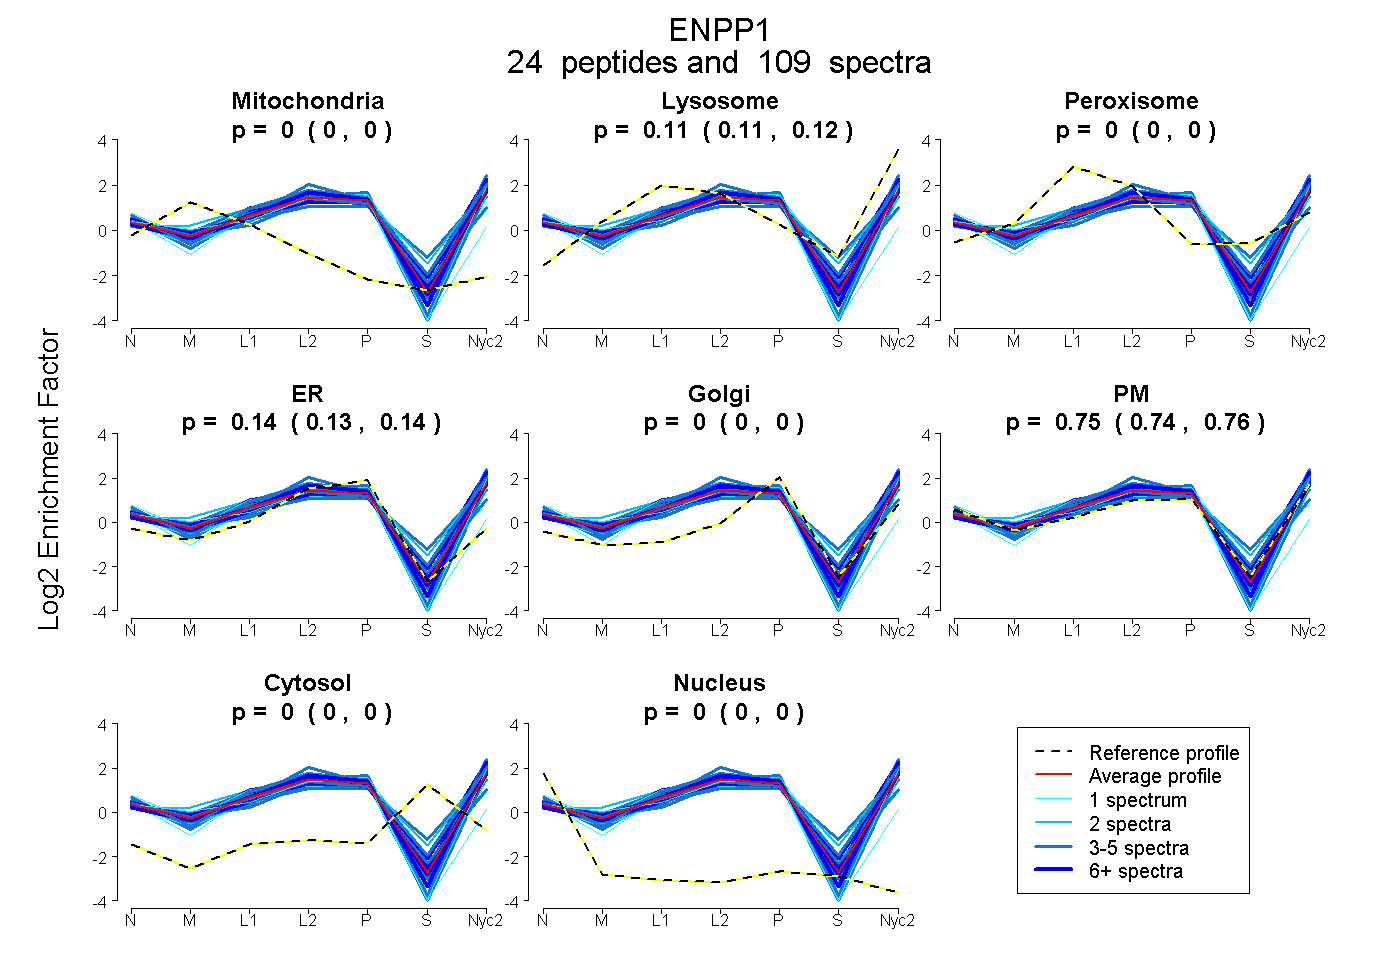
0.000 | 0.000
0.109 | 0.116
0.000 | 0.000
0.132 | 0.142
0.000 | 0.000
0.744 | 0.755
0.000 | 0.000
0.000 | 0.000
13peptides
spectra
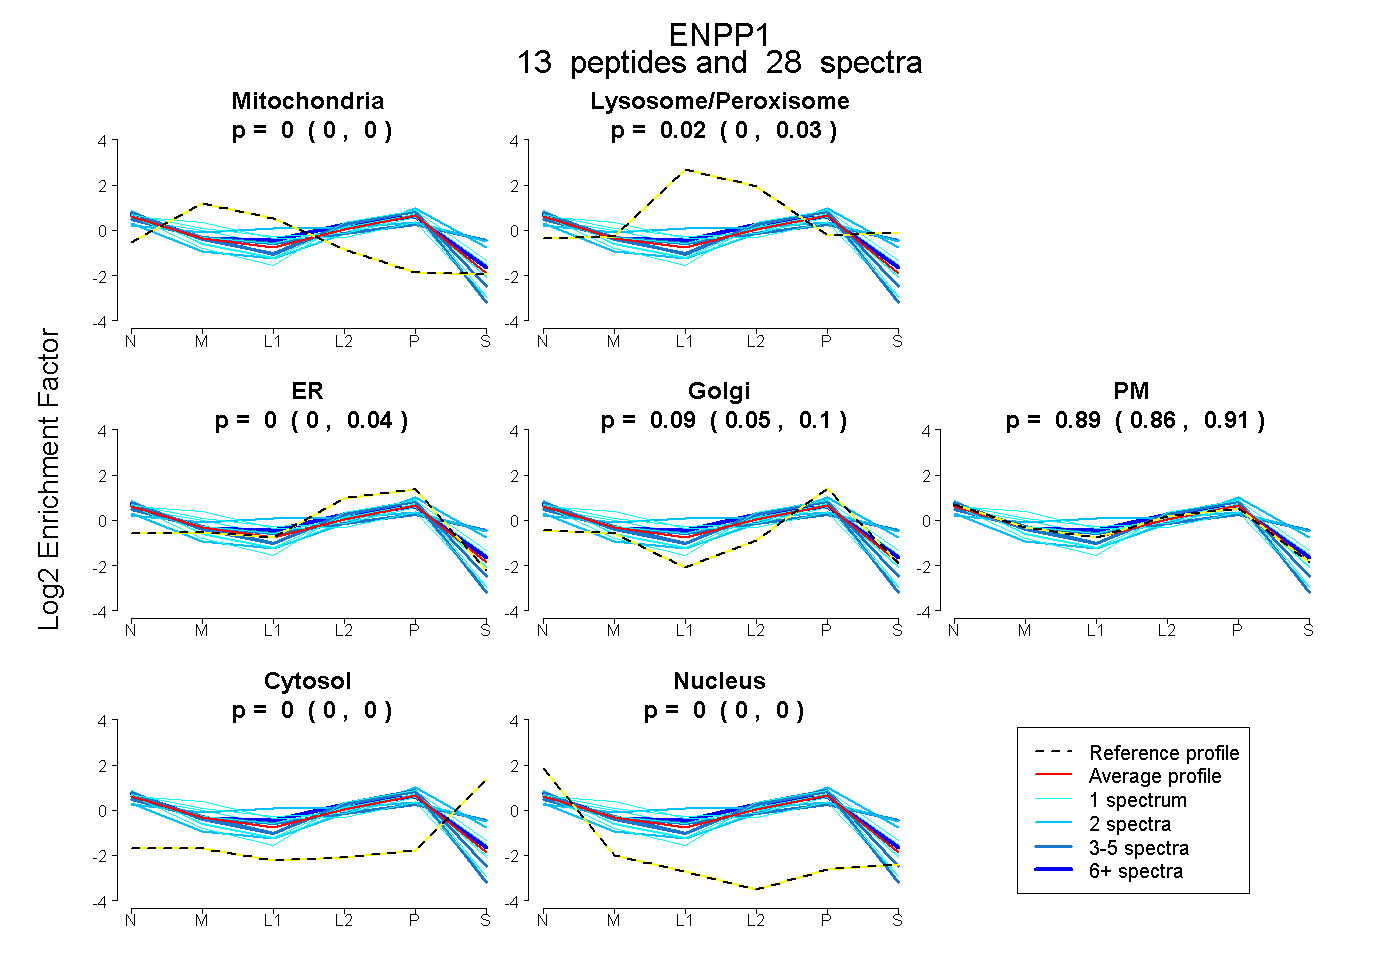
0.000 | 0.003
0.000 | 0.031
0.000 | 0.035
0.053 | 0.105
0.861 | 0.911
0.000 | 0.000
0.000 | 0.000
26peptides
spectra
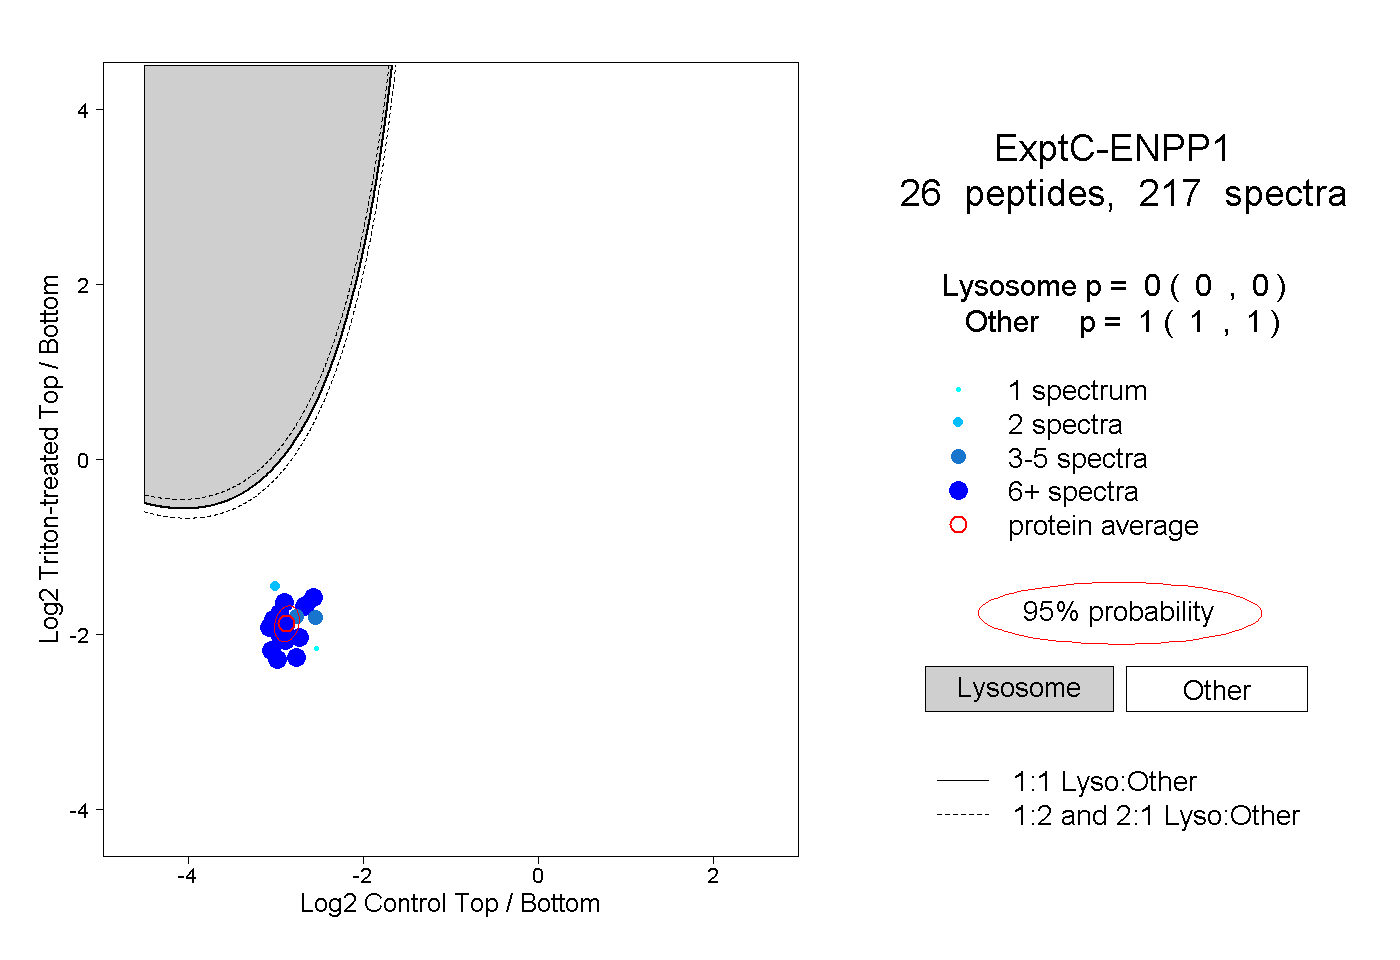
0.000 | 0.000
1.000 | 1.000
8peptides
spectra
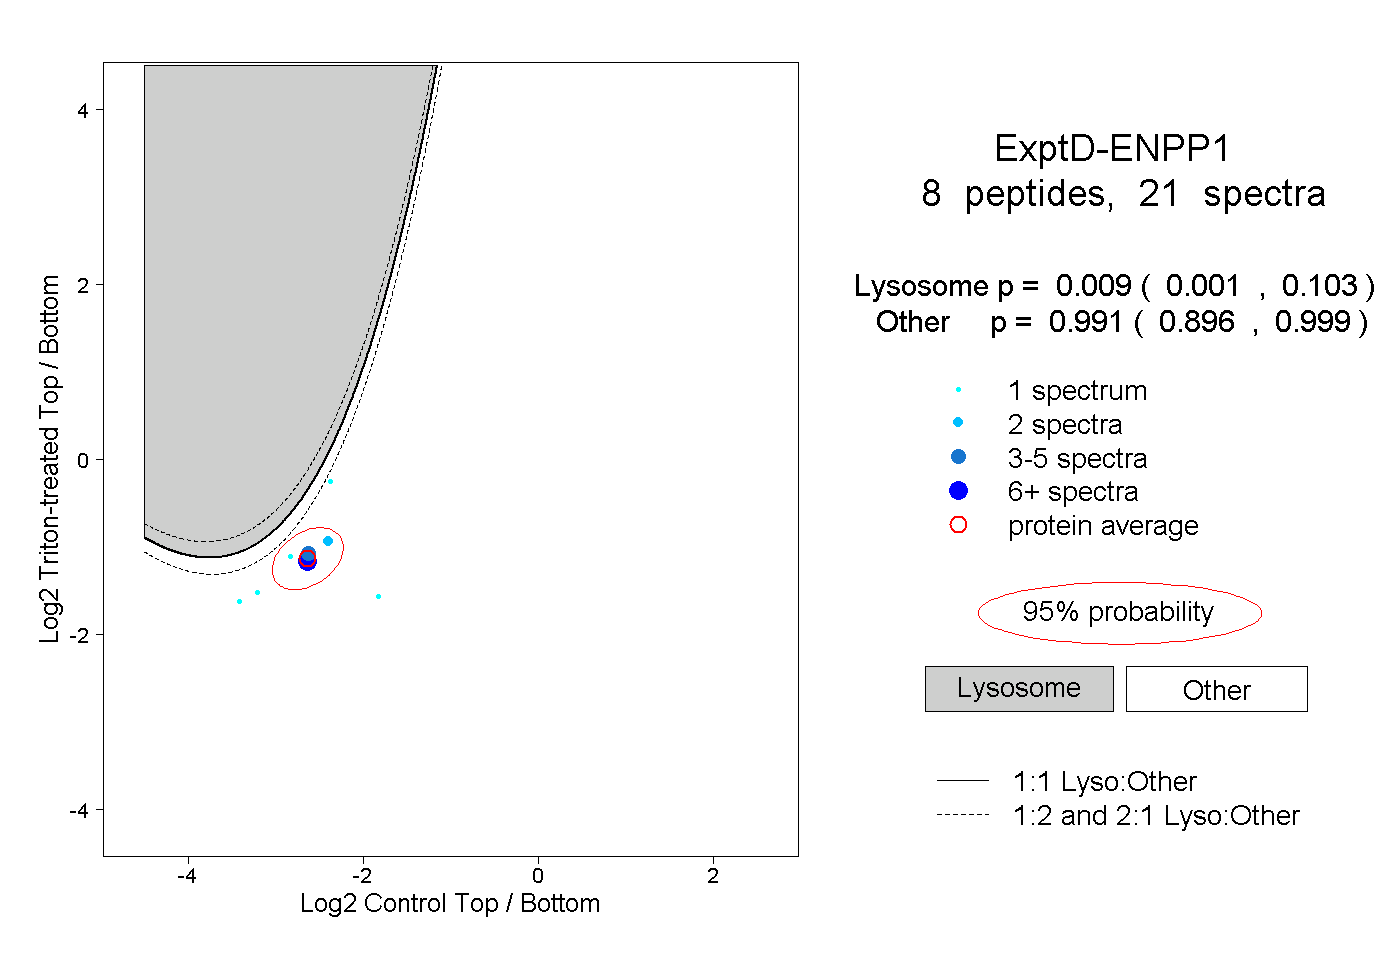
0.001 | 0.103
0.896 | 0.999