 24
24peptides
spectra
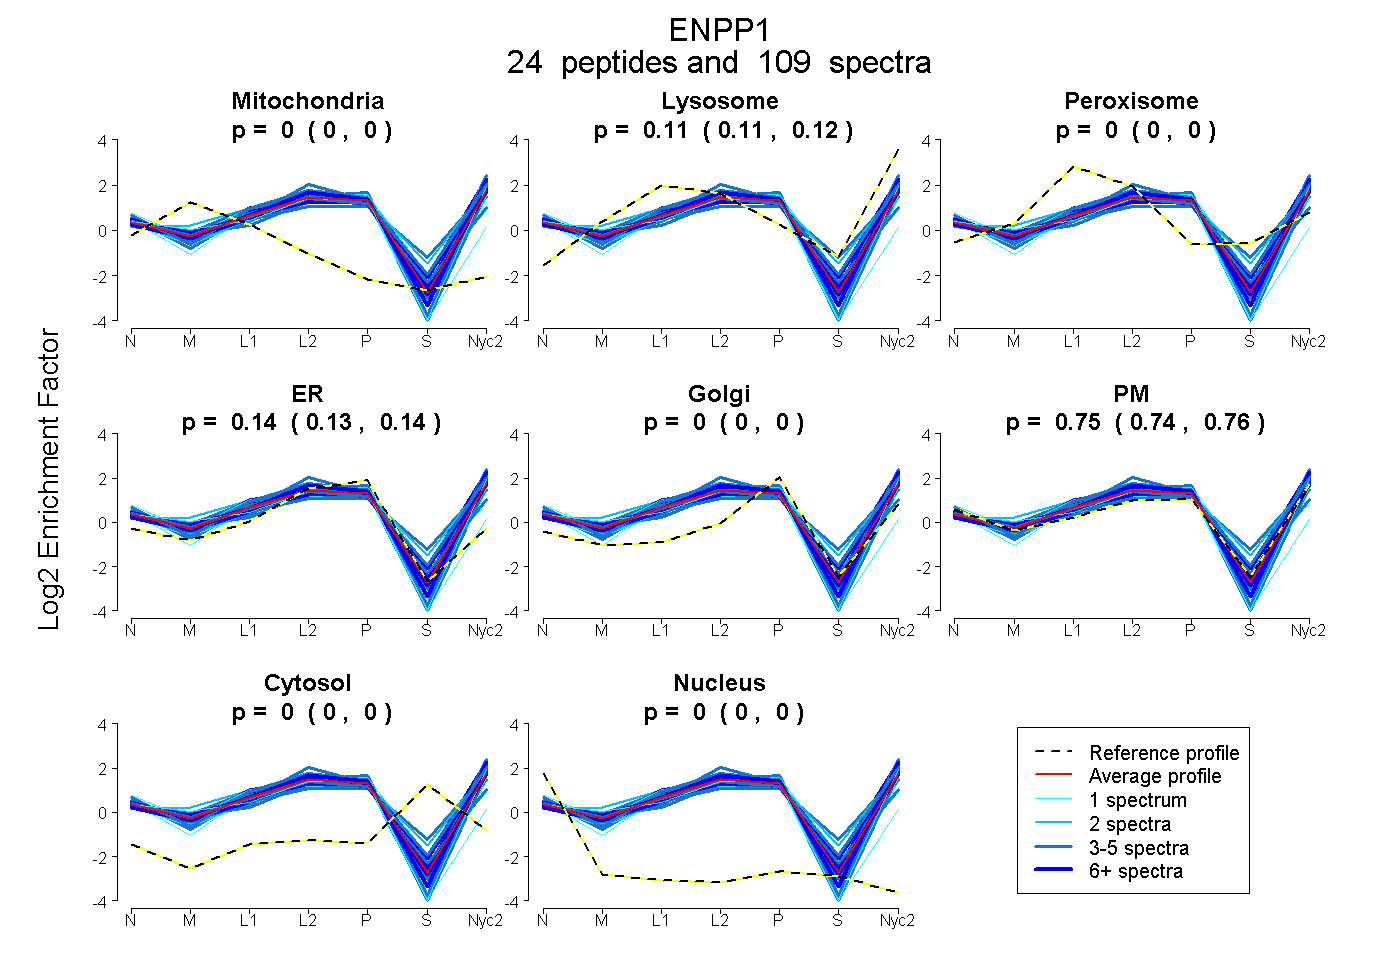
0.000 | 0.000
0.109 | 0.116
0.000 | 0.000
0.132 | 0.142
0.000 | 0.000
0.744 | 0.755
0.000 | 0.000
0.000 | 0.000
| Plot | Mito | Lyso | Perox | ER | Golgi | PM | Cytosol | Nucleus | |||||
| Expt A |
24 peptides |
109 spectra |
|
0.000 0.000 | 0.000 |
0.112 0.109 | 0.116 |
0.000 0.000 | 0.000 |
0.137 0.132 | 0.142 |
0.000 0.000 | 0.000 |
0.750 0.744 | 0.755 |
0.000 0.000 | 0.000 |
0.000 0.000 | 0.000 |
| 8 spectra, GQPIWVTANHQEVR | 0.000 | 0.238 | 0.010 | 0.011 | 0.000 | 0.741 | 0.000 | 0.000 | ||
| 1 spectrum, YVYLNK | 0.000 | 0.000 | 0.000 | 0.046 | 0.000 | 0.954 | 0.000 | 0.000 | ||
| 4 spectra, QESAWVEELLALHR | 0.000 | 0.015 | 0.000 | 0.101 | 0.000 | 0.884 | 0.000 | 0.000 | ||
| 1 spectrum, SQENLIPTHFFIVLTSCK | 0.105 | 0.000 | 0.000 | 0.509 | 0.000 | 0.387 | 0.000 | 0.000 | ||
| 6 spectra, LSYGFLTPPR | 0.000 | 0.181 | 0.000 | 0.116 | 0.000 | 0.702 | 0.000 | 0.000 | ||
| 5 spectra, FNPLWYK | 0.000 | 0.084 | 0.000 | 0.079 | 0.000 | 0.838 | 0.000 | 0.000 | ||
| 1 spectrum, AHNDCCINYSSVCQEK | 0.000 | 0.000 | 0.114 | 0.450 | 0.000 | 0.436 | 0.000 | 0.000 | ||
| 5 spectra, DGEQAGQGPR | 0.000 | 0.000 | 0.000 | 0.214 | 0.000 | 0.786 | 0.000 | 0.000 | ||
| 4 spectra, VTDVELITGLSFYQDR | 0.000 | 0.000 | 0.000 | 0.003 | 0.000 | 0.997 | 0.000 | 0.000 | ||
| 1 spectrum, DLGLDK | 0.000 | 0.000 | 0.000 | 0.220 | 0.000 | 0.780 | 0.000 | 0.000 | ||
| 2 spectra, QLSESPLK | 0.000 | 0.168 | 0.034 | 0.078 | 0.000 | 0.693 | 0.028 | 0.000 | ||
| 3 spectra, NGVNVVSGPVFDFDYDGR | 0.000 | 0.174 | 0.000 | 0.055 | 0.000 | 0.771 | 0.000 | 0.000 | ||
| 3 spectra, YLGDVNNVK | 0.000 | 0.169 | 0.028 | 0.015 | 0.000 | 0.789 | 0.000 | 0.000 | ||
| 5 spectra, NCGTYTK | 0.000 | 0.000 | 0.120 | 0.300 | 0.000 | 0.580 | 0.000 | 0.000 | ||
| 5 spectra, NMRPVYPTK | 0.000 | 0.234 | 0.000 | 0.055 | 0.000 | 0.711 | 0.000 | 0.000 | ||
| 5 spectra, ETNQHFRPYLK | 0.000 | 0.093 | 0.003 | 0.065 | 0.000 | 0.840 | 0.000 | 0.000 | ||
| 3 spectra, EESFLSQCPIK | 0.000 | 0.102 | 0.024 | 0.176 | 0.000 | 0.689 | 0.009 | 0.000 | ||
| 23 spectra, VVYGPAAR | 0.000 | 0.090 | 0.000 | 0.095 | 0.000 | 0.815 | 0.000 | 0.000 | ||
| 8 spectra, VDHIVGMLMDGLK | 0.000 | 0.190 | 0.000 | 0.124 | 0.000 | 0.686 | 0.000 | 0.000 | ||
| 2 spectra, AEYLHTWGGLLPVISK | 0.014 | 0.184 | 0.000 | 0.137 | 0.000 | 0.665 | 0.000 | 0.000 | ||
| 1 spectrum, KPIYTPSHPK | 0.000 | 0.078 | 0.000 | 0.241 | 0.000 | 0.681 | 0.000 | 0.000 | ||
| 7 spectra, YDSSEILK | 0.000 | 0.079 | 0.000 | 0.006 | 0.000 | 0.915 | 0.000 | 0.000 | ||
| 1 spectrum, DPNTYK | 0.000 | 0.133 | 0.000 | 0.322 | 0.000 | 0.545 | 0.000 | 0.000 | ||
| 5 spectra, QESVSELLR | 0.000 | 0.141 | 0.072 | 0.000 | 0.000 | 0.697 | 0.090 | 0.000 |
| Plot | Mito | Lyso or Perox | ER | Golgi | PM | Cytosol | Nucleus | ||||||
| Expt B |
13 peptides |
28 spectra |
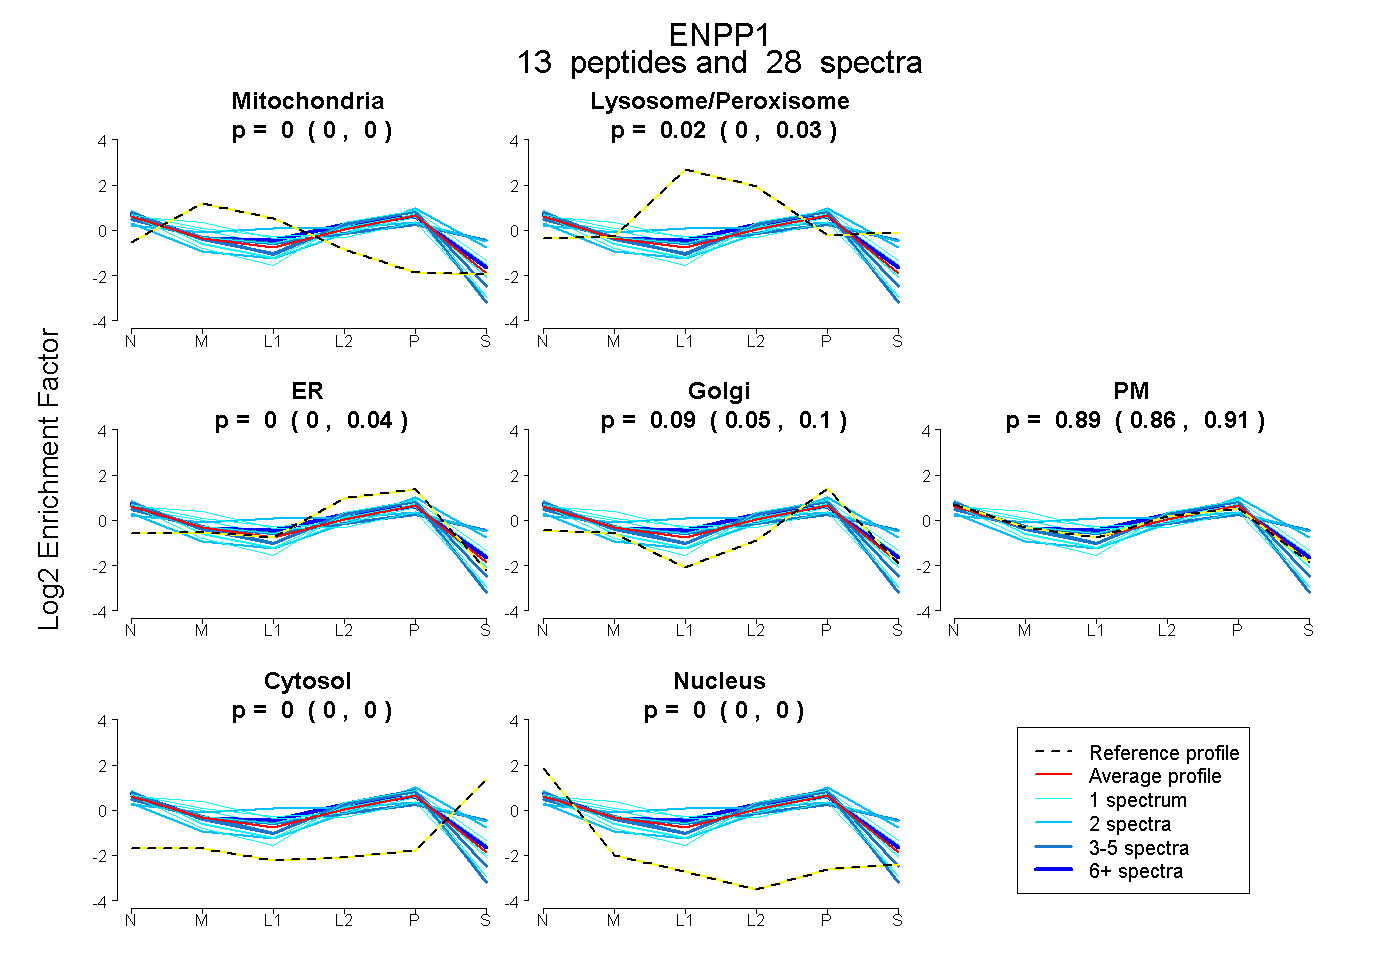 |
0.000 0.000 | 0.003 |
0.017 0.000 | 0.031 |
0.002 0.000 | 0.035 |
0.087 0.053 | 0.105 |
0.894 0.861 | 0.911 |
0.000 0.000 | 0.000 |
0.000 0.000 | 0.000 |
|||
| Plot | Lyso | Other | |||||||||||
| Expt C |
26 peptides |
217 spectra |
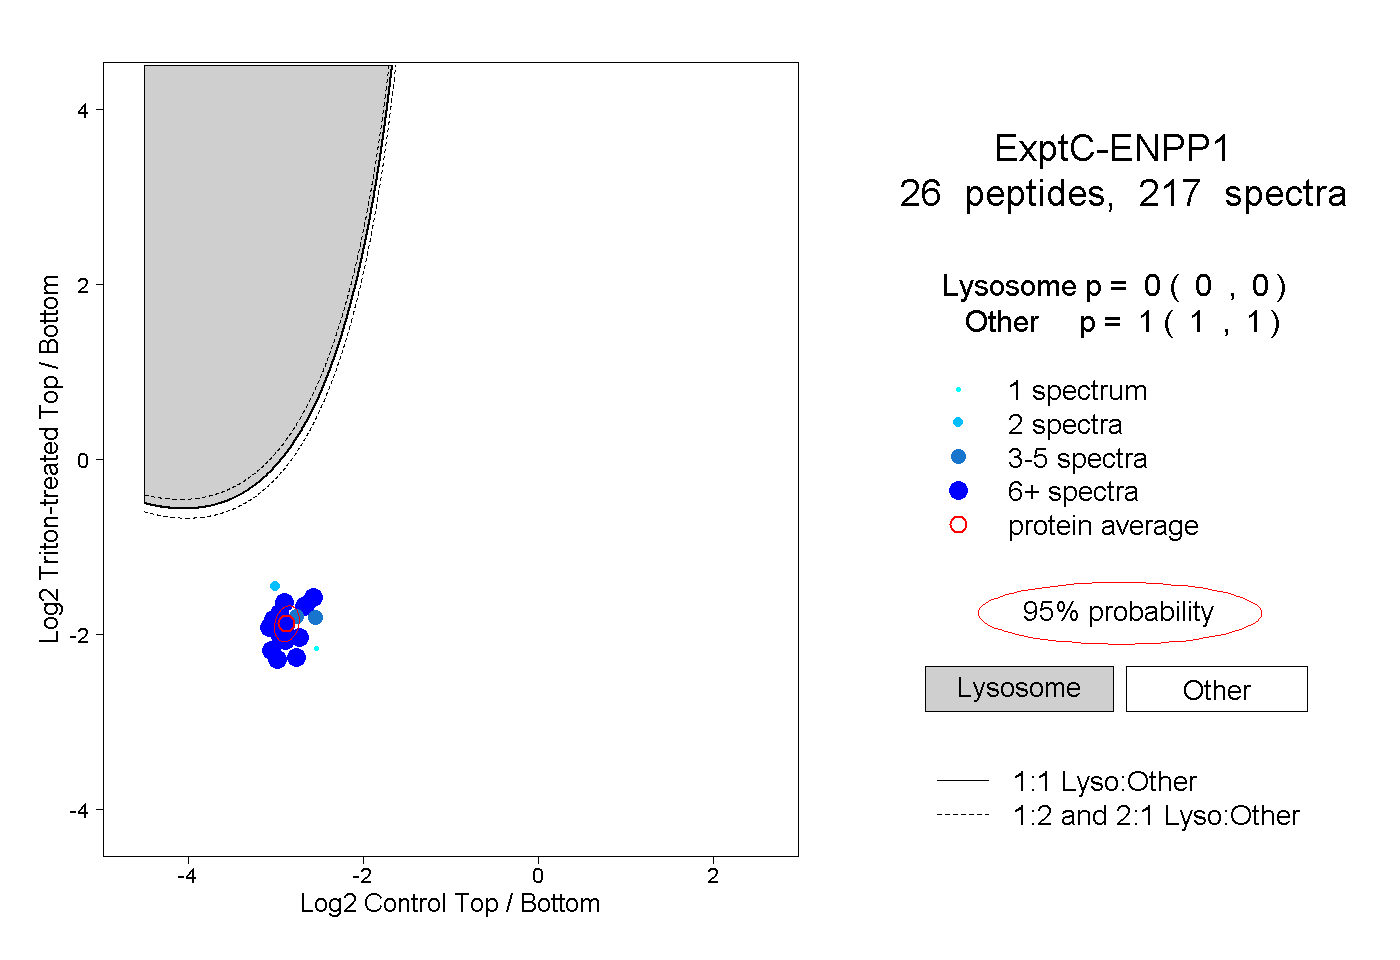 |
0.000 0.000 | 0.000 |
1.000 1.000 | 1.000 |
||||||||
| Plot | Lyso | Other | |||||||||||
| Expt D |
8 peptides |
21 spectra |
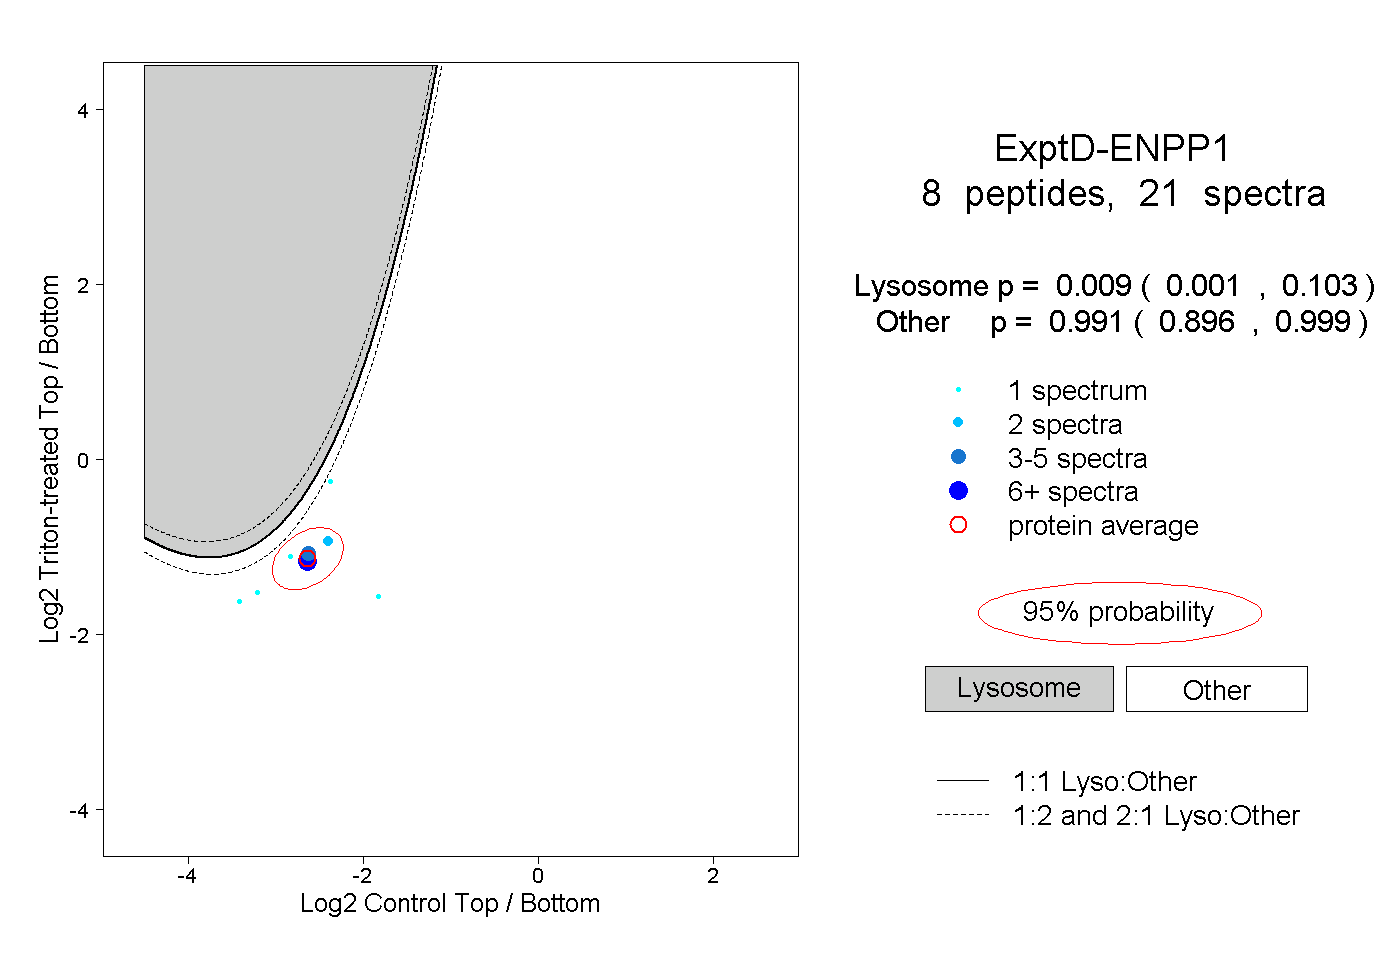 |
0.009 0.001 | 0.103 |
0.991 0.896 | 0.999 |