 3
3peptides
spectra
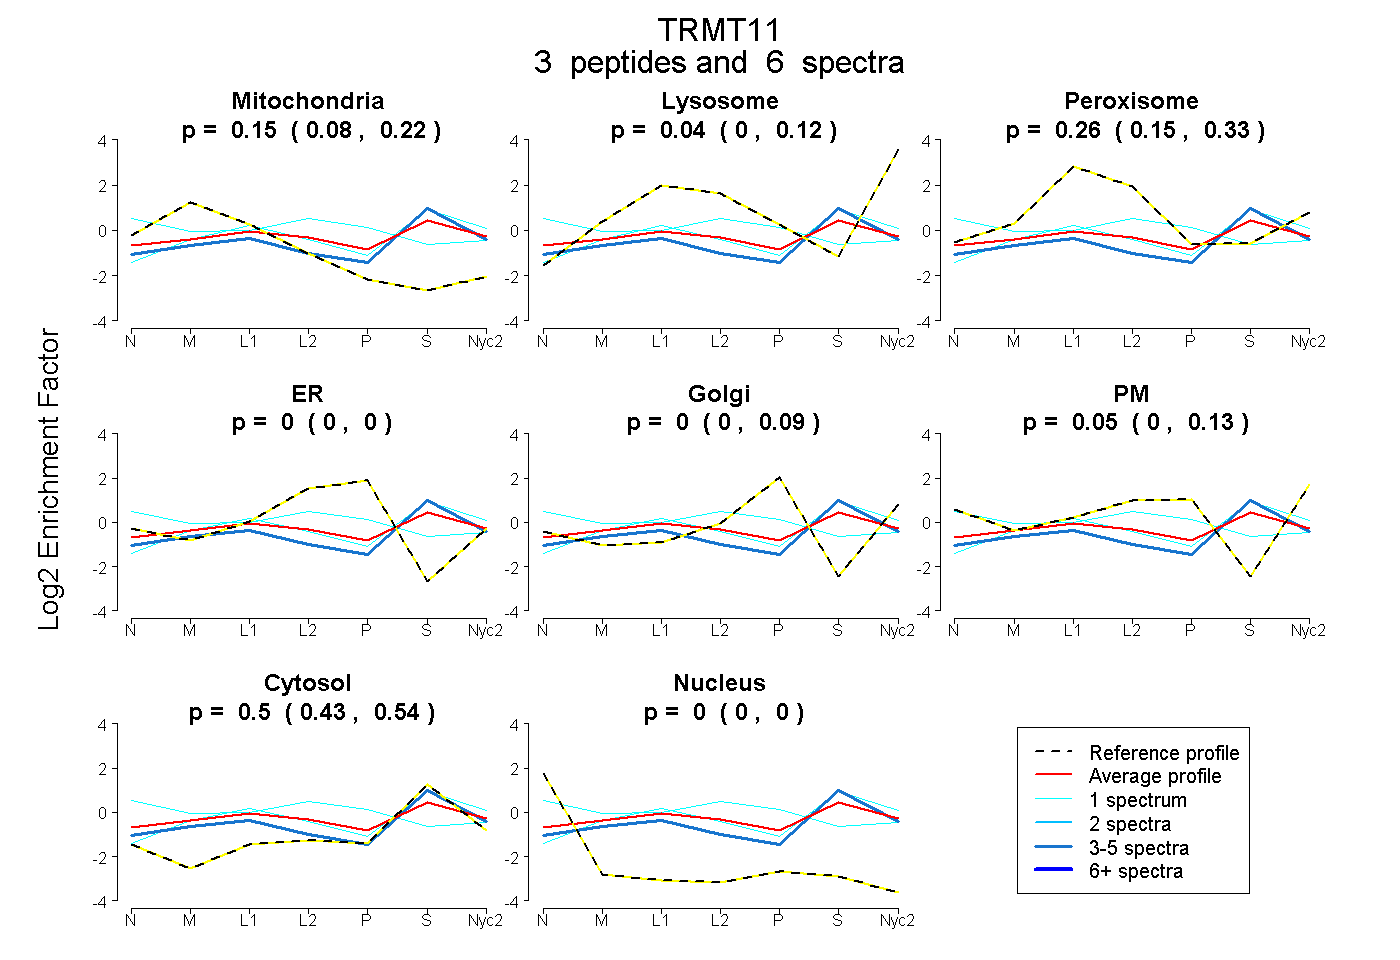
0.081 | 0.217
0.000 | 0.119
0.148 | 0.332
0.000 | 0.000
0.000 | 0.090
0.000 | 0.130
0.430 | 0.544
0.000 | 0.000
1peptide
spectrum
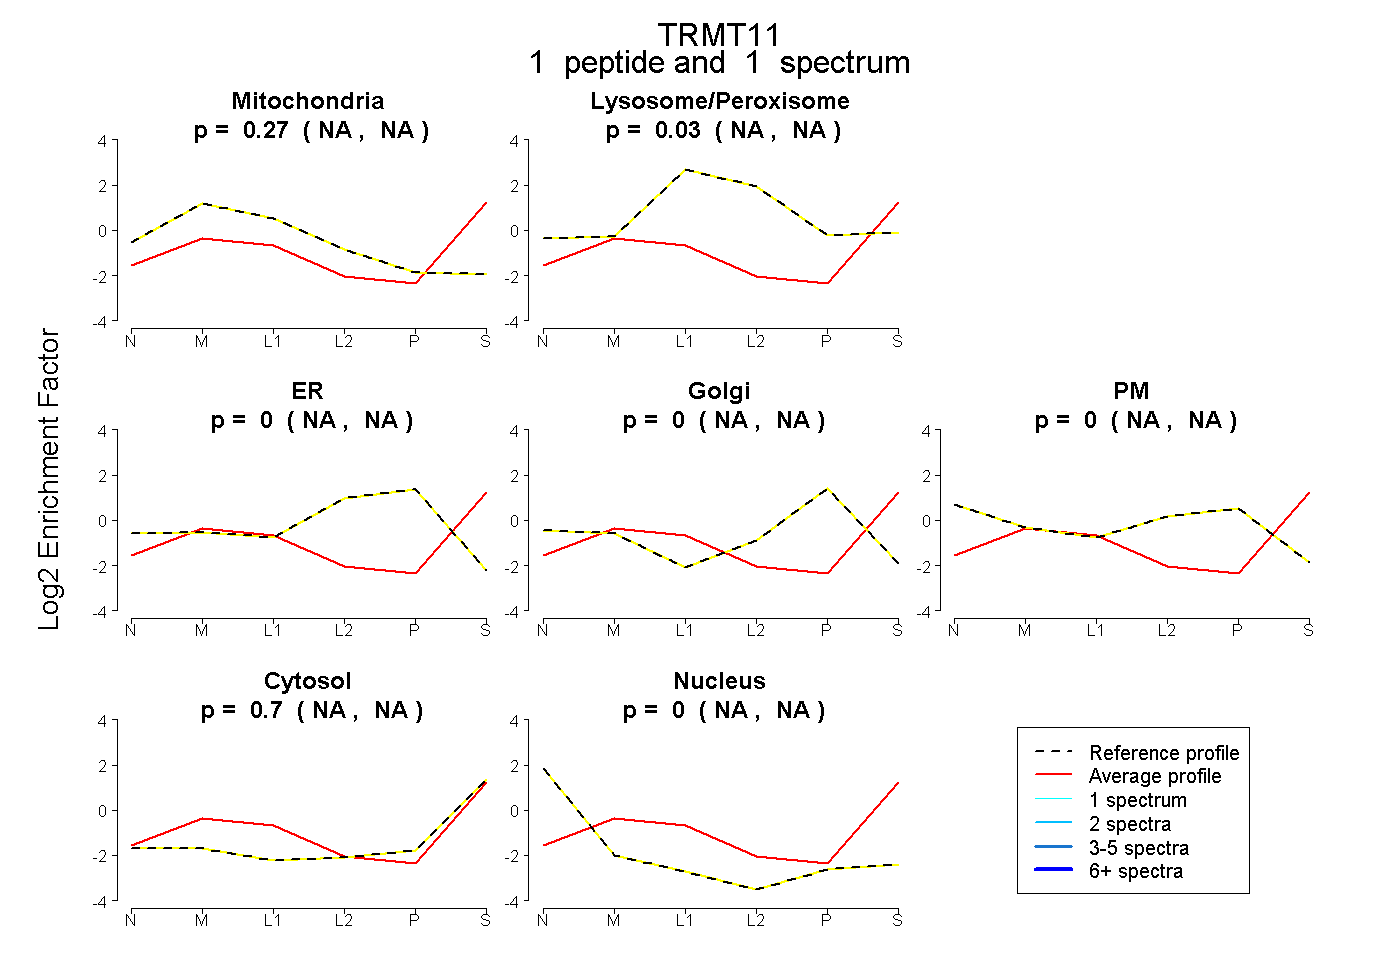
NA | NA
NA | NA
NA | NA
NA | NA
NA | NA
NA | NA
NA | NA
6peptides
spectra
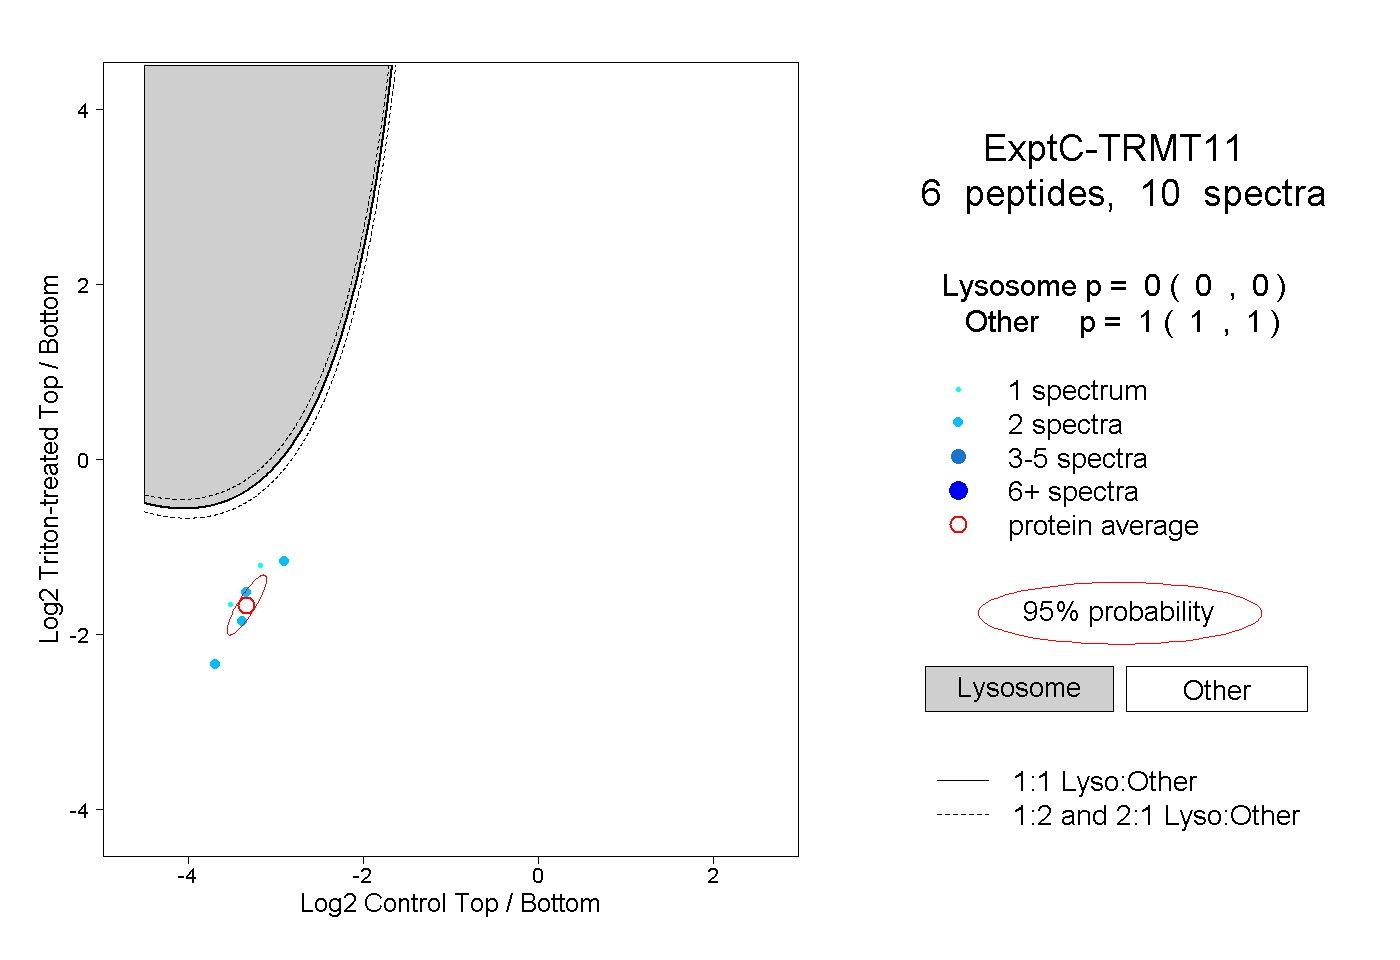
0.000 | 0.000
1.000 | 1.000