 3
3peptides
spectra
0.081 | 0.217
0.000 | 0.119
0.148 | 0.332
0.000 | 0.000
0.000 | 0.090
0.000 | 0.130
0.430 | 0.544
0.000 | 0.000
| Plot | Mito | Lyso | Perox | ER | Golgi | PM | Cytosol | Nucleus | |||||
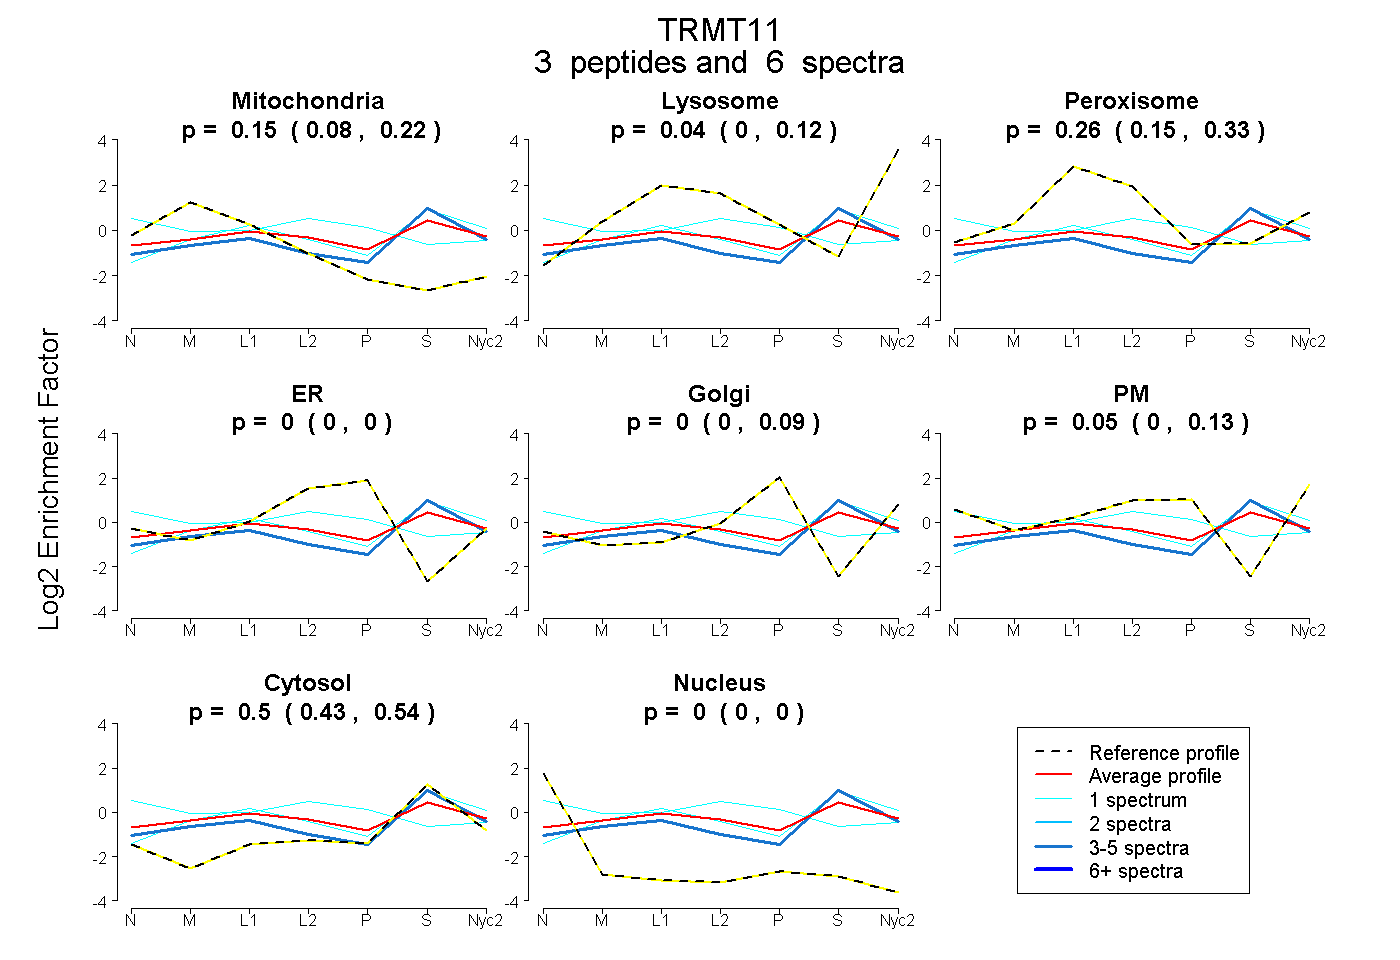
| Expt A |
3 peptides |
6 spectra |
|
0.153 0.081 | 0.217 |
0.039 0.000 | 0.119 |
0.256 0.148 | 0.332 |
0.000 0.000 | 0.000 |
0.000 0.000 | 0.090 |
0.052 0.000 | 0.130 |
0.500 0.430 | 0.544 |
0.000 0.000 | 0.000 |
| 1 spectrum, MVPWHPCLR | 0.126 | 0.000 | 0.220 | 0.181 | 0.000 | 0.222 | 0.201 | 0.049 | ||
| 4 spectra, SLFELWGHGK | 0.157 | 0.054 | 0.137 | 0.000 | 0.000 | 0.000 | 0.652 | 0.000 | ||
| 1 spectrum, LITMEK | 0.073 | 0.134 | 0.235 | 0.000 | 0.000 | 0.000 | 0.557 | 0.000 |
| Plot | Mito | Lyso or Perox | ER | Golgi | PM | Cytosol | Nucleus | ||||||
| Expt B |
1 peptide |
1 spectrum |
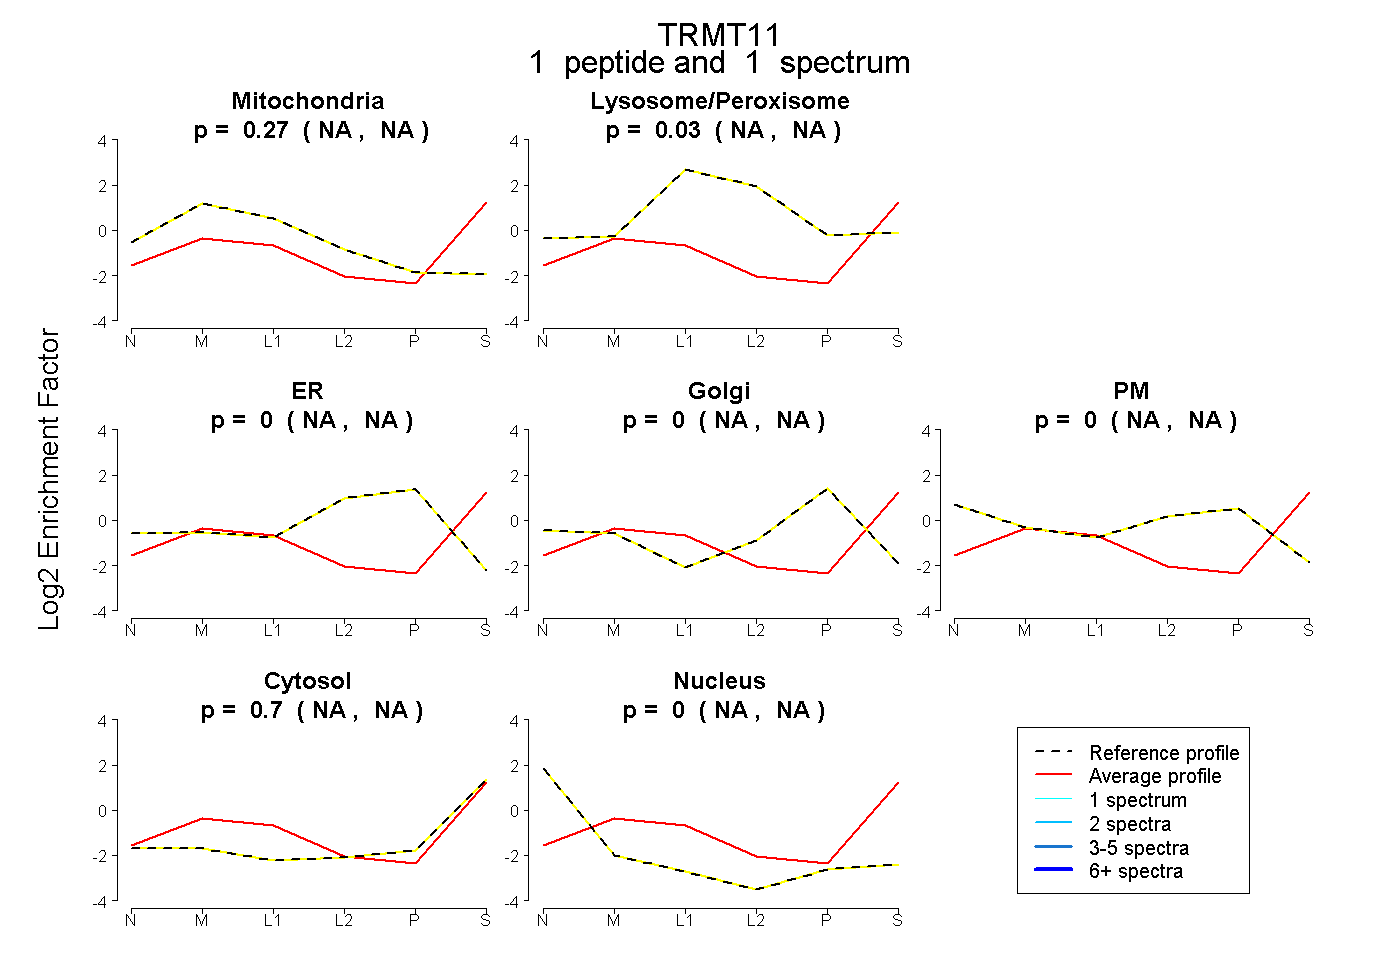 |
0.272 NA | NA |
0.026 NA | NA |
0.000 NA | NA |
0.000 NA | NA |
0.000 NA | NA |
0.702 NA | NA |
0.000 NA | NA |
|||
| Plot | Lyso | Other | |||||||||||
| Expt C |
6 peptides |
10 spectra |
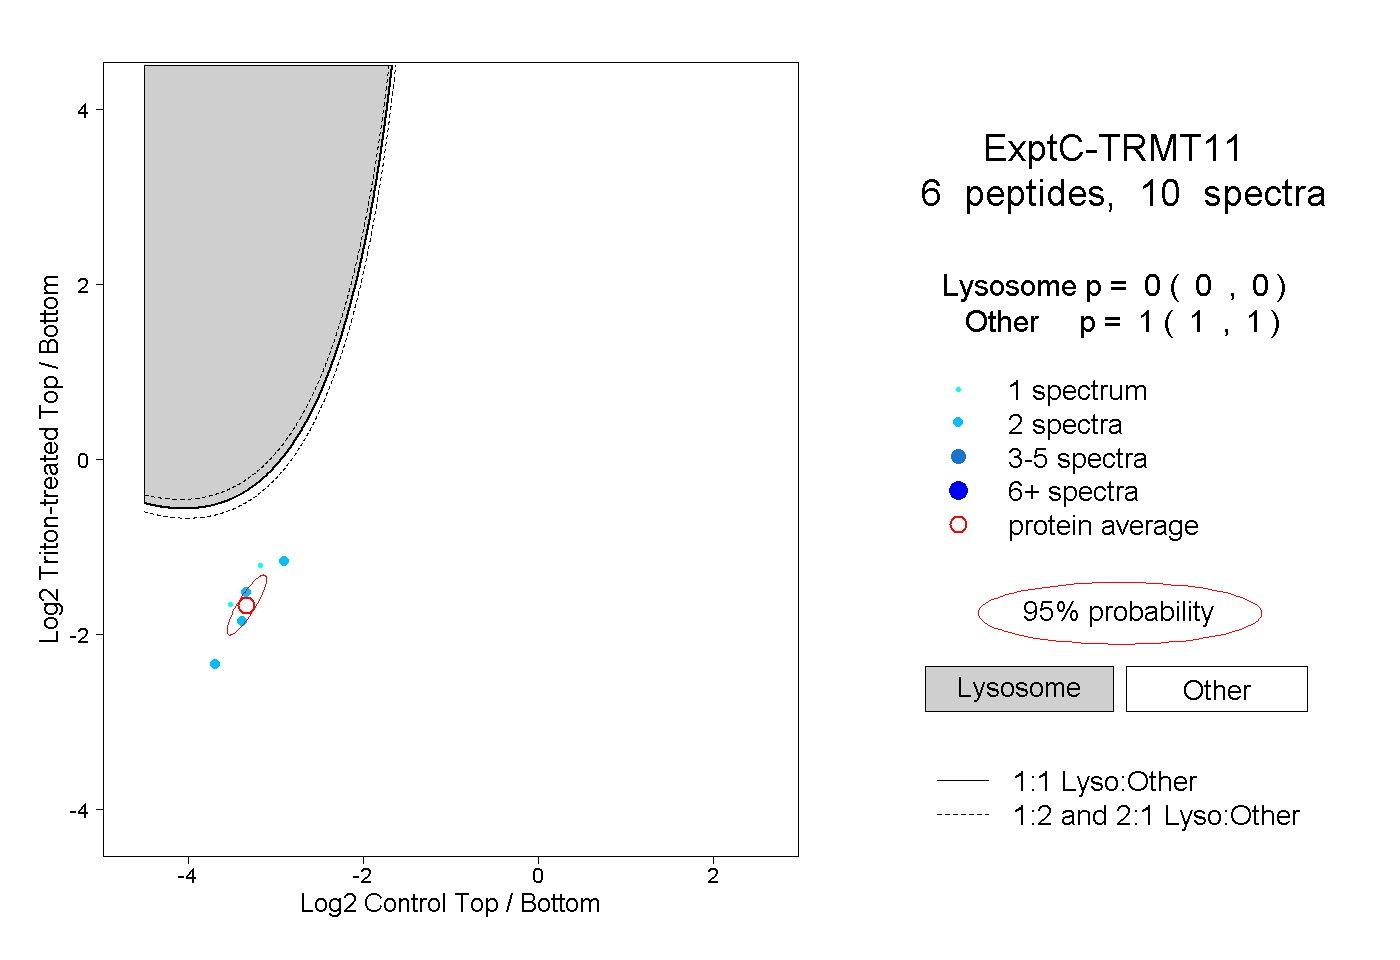 |
0.000 0.000 | 0.000 |
1.000 1.000 | 1.000 |