 4
4peptides
spectra
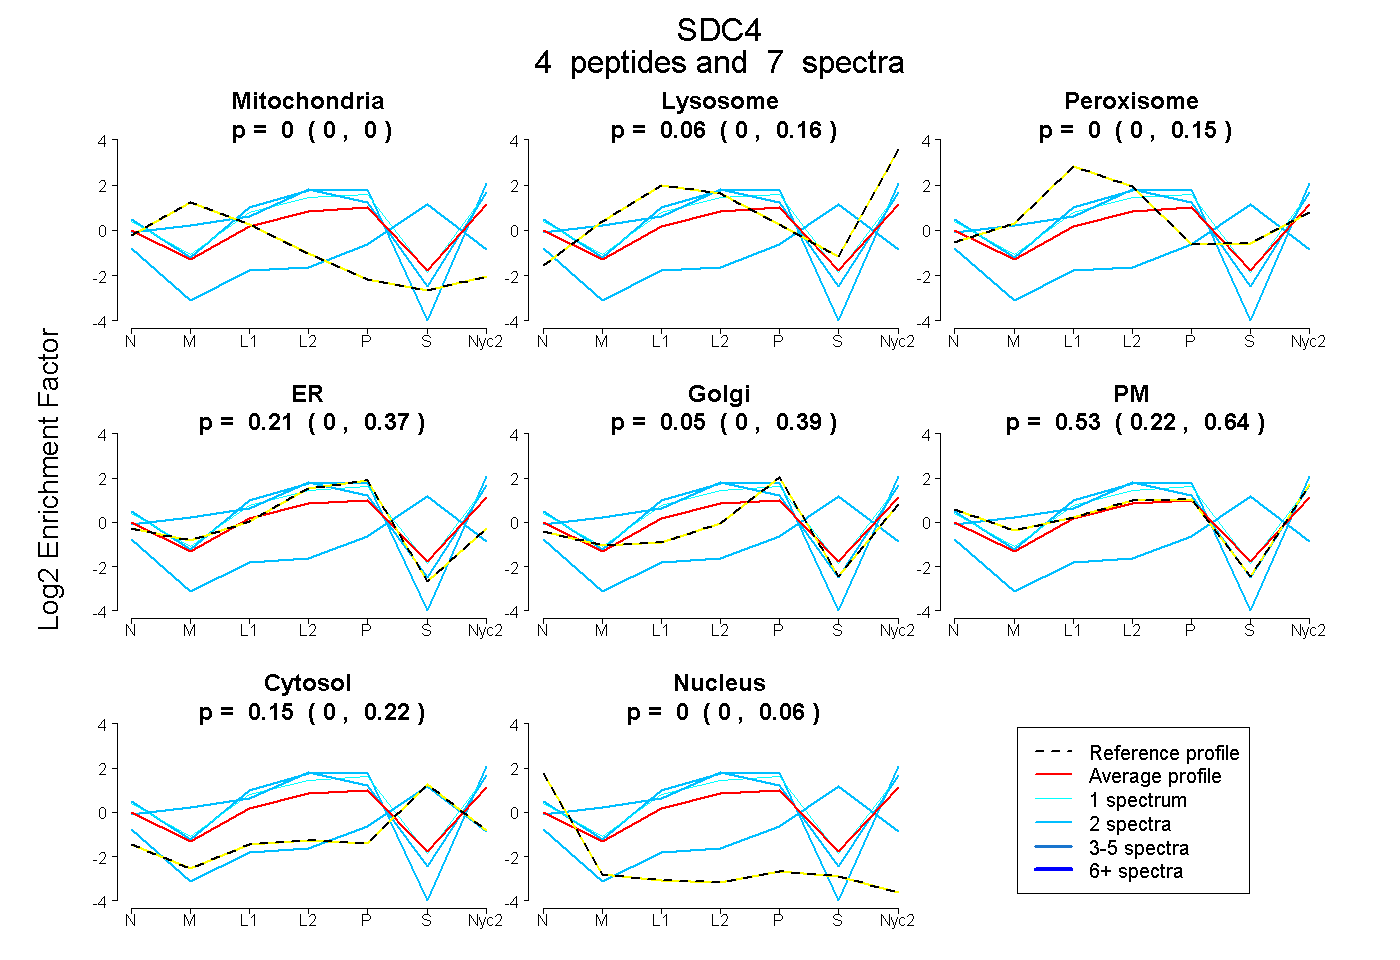
0.000 | 0.000
0.000 | 0.160
0.000 | 0.149
0.000 | 0.369
0.000 | 0.388
0.220 | 0.640
0.000 | 0.224
0.000 | 0.064
3peptides
spectra
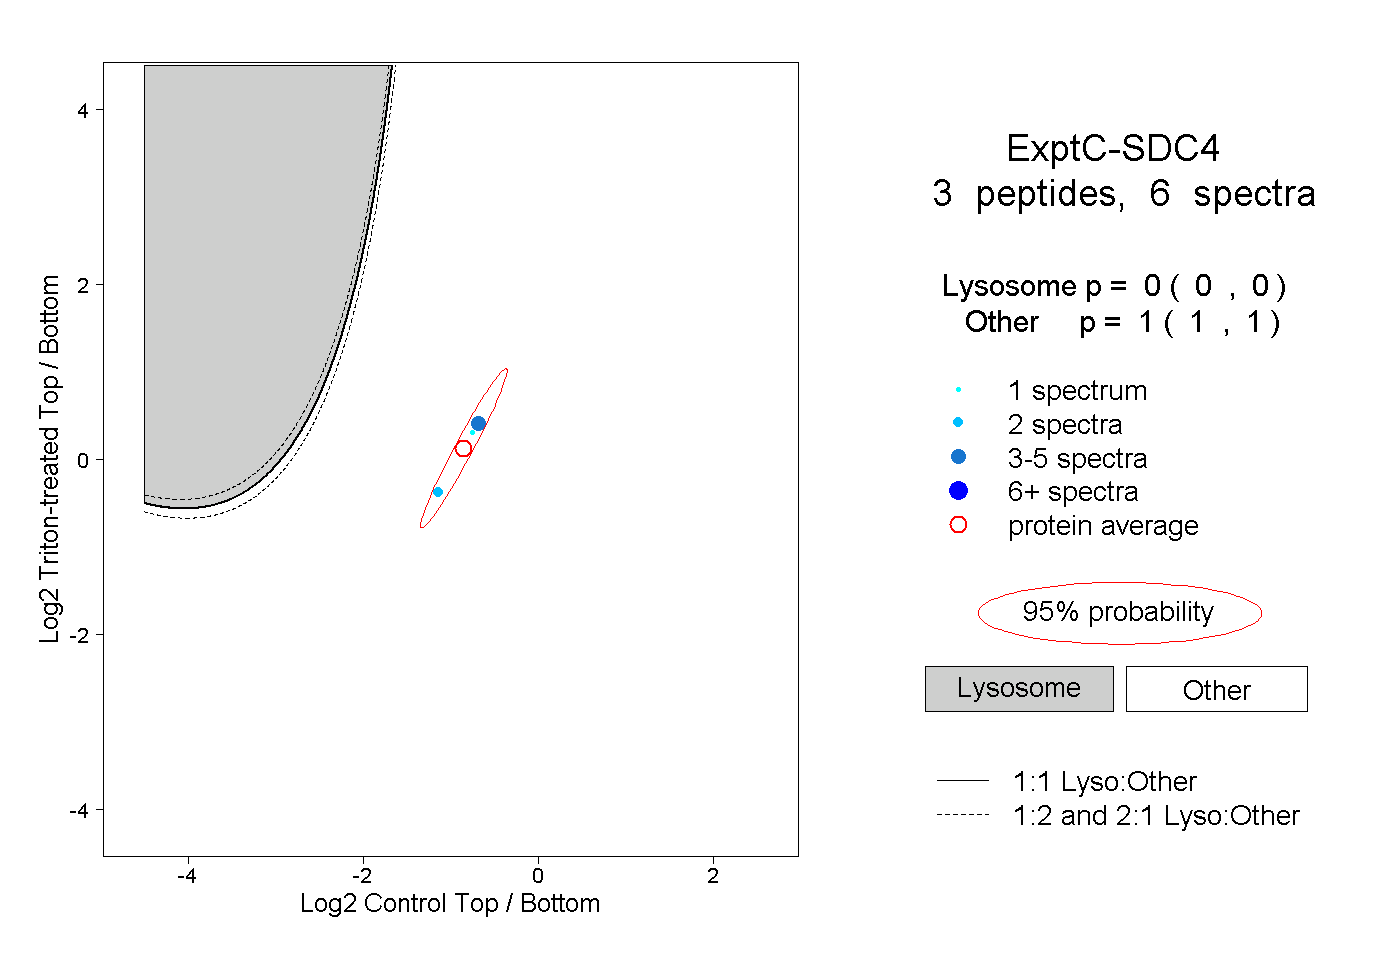
0.000 | 0.000
1.000 | 1.000
1peptide
spectrum
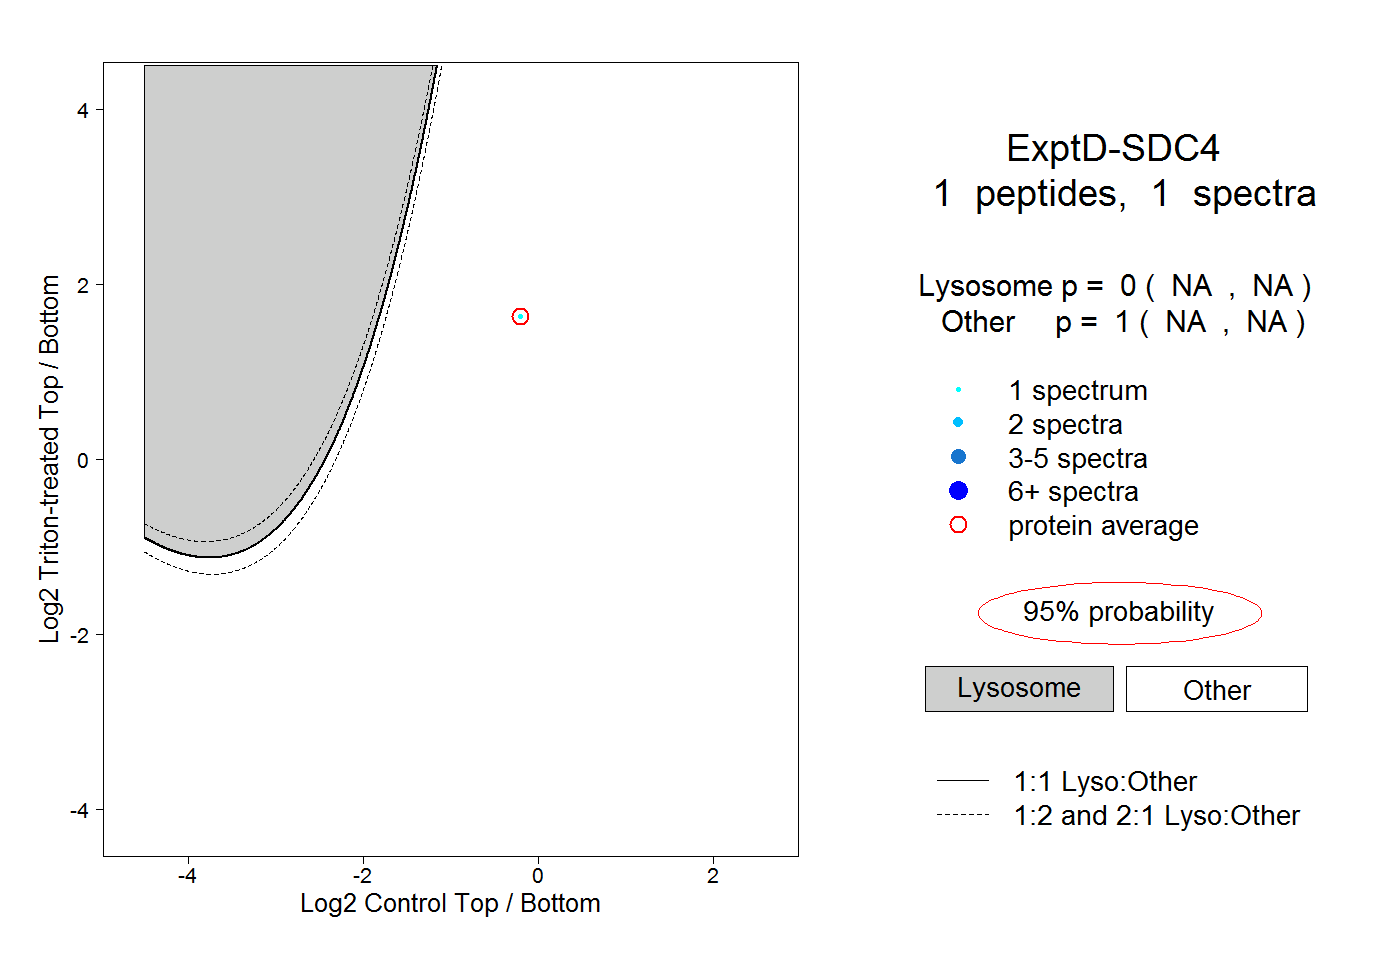
NA | NA
NA | NA