 4
4peptides
spectra
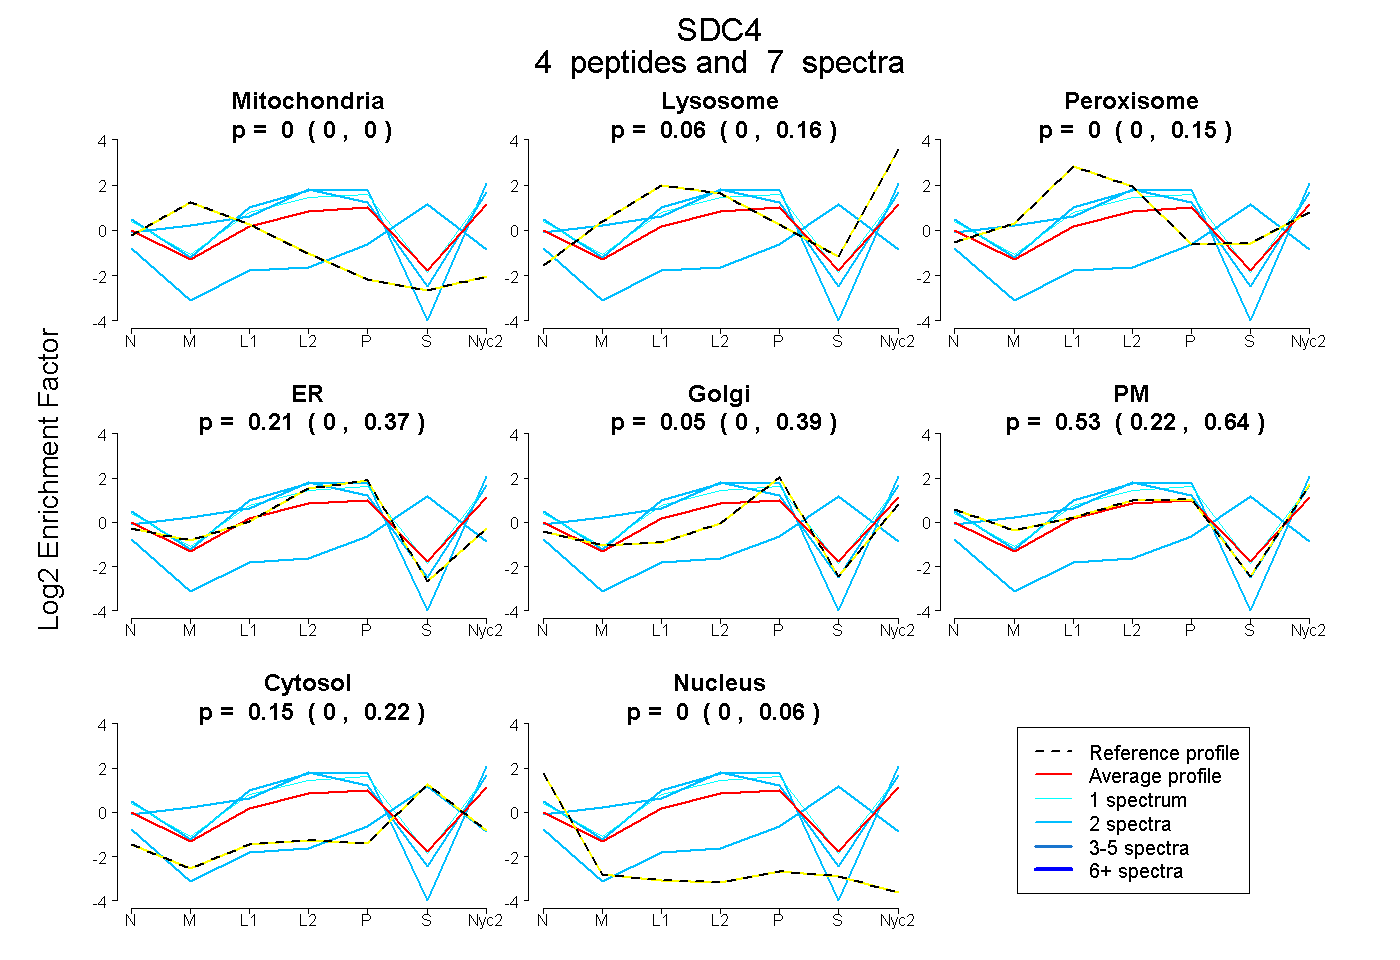
0.000 | 0.000
0.000 | 0.160
0.000 | 0.149
0.000 | 0.369
0.000 | 0.388
0.220 | 0.640
0.000 | 0.224
0.000 | 0.064
| Plot | Mito | Lyso | Perox | ER | Golgi | PM | Cytosol | Nucleus | |||||
| Expt A |
4 peptides |
7 spectra |
|
0.000 0.000 | 0.000 |
0.061 0.000 | 0.160 |
0.000 0.000 | 0.149 |
0.205 0.000 | 0.369 |
0.047 0.000 | 0.388 |
0.534 0.220 | 0.640 |
0.152 0.000 | 0.224 |
0.000 0.000 | 0.064 |
| 2 spectra, VSMSSTSQGSNIFER | 0.000 | 0.000 | 0.000 | 0.000 | 0.053 | 0.000 | 0.887 | 0.060 | ||
| 2 spectra, DEGSYDLGK | 0.000 | 0.000 | 0.000 | 0.163 | 0.000 | 0.837 | 0.000 | 0.000 | ||
| 1 spectrum, ETEVIDPQDLLEGR | 0.000 | 0.131 | 0.025 | 0.243 | 0.000 | 0.602 | 0.000 | 0.000 | ||
| 2 spectra, TFPEVISPLVPLDNHIPENAQPGIR | 0.000 | 0.259 | 0.000 | 0.286 | 0.000 | 0.455 | 0.000 | 0.000 |
| Plot | Lyso | Other | |||||||||||
| Expt C |
3 peptides |
6 spectra |
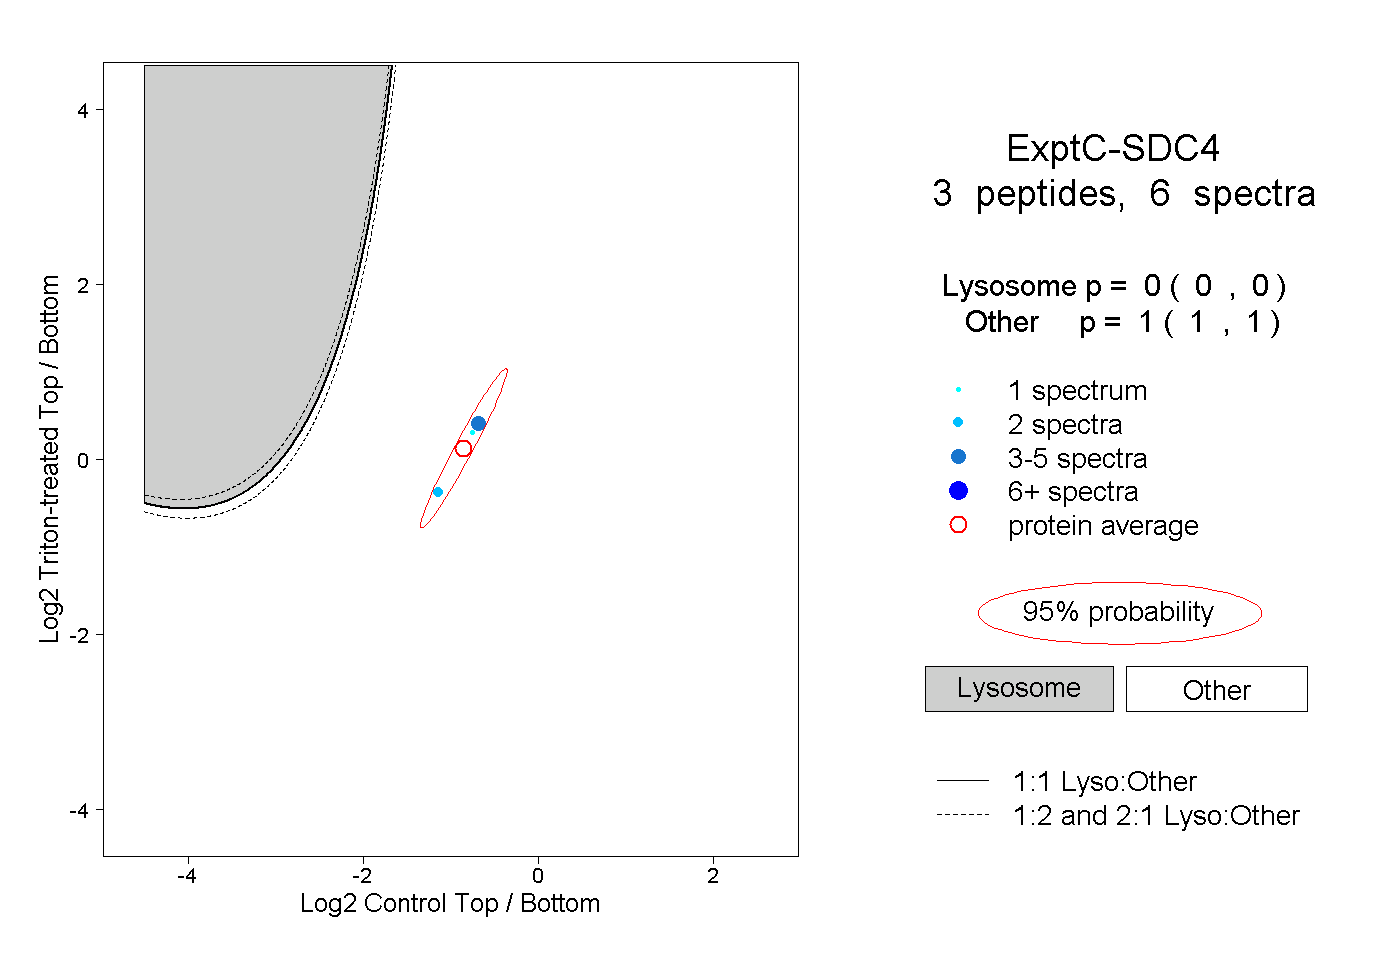 |
0.000 0.000 | 0.000 |
1.000 1.000 | 1.000 |
||||||||
| Plot | Lyso | Other | |||||||||||
| Expt D |
1 peptide |
1 spectrum |
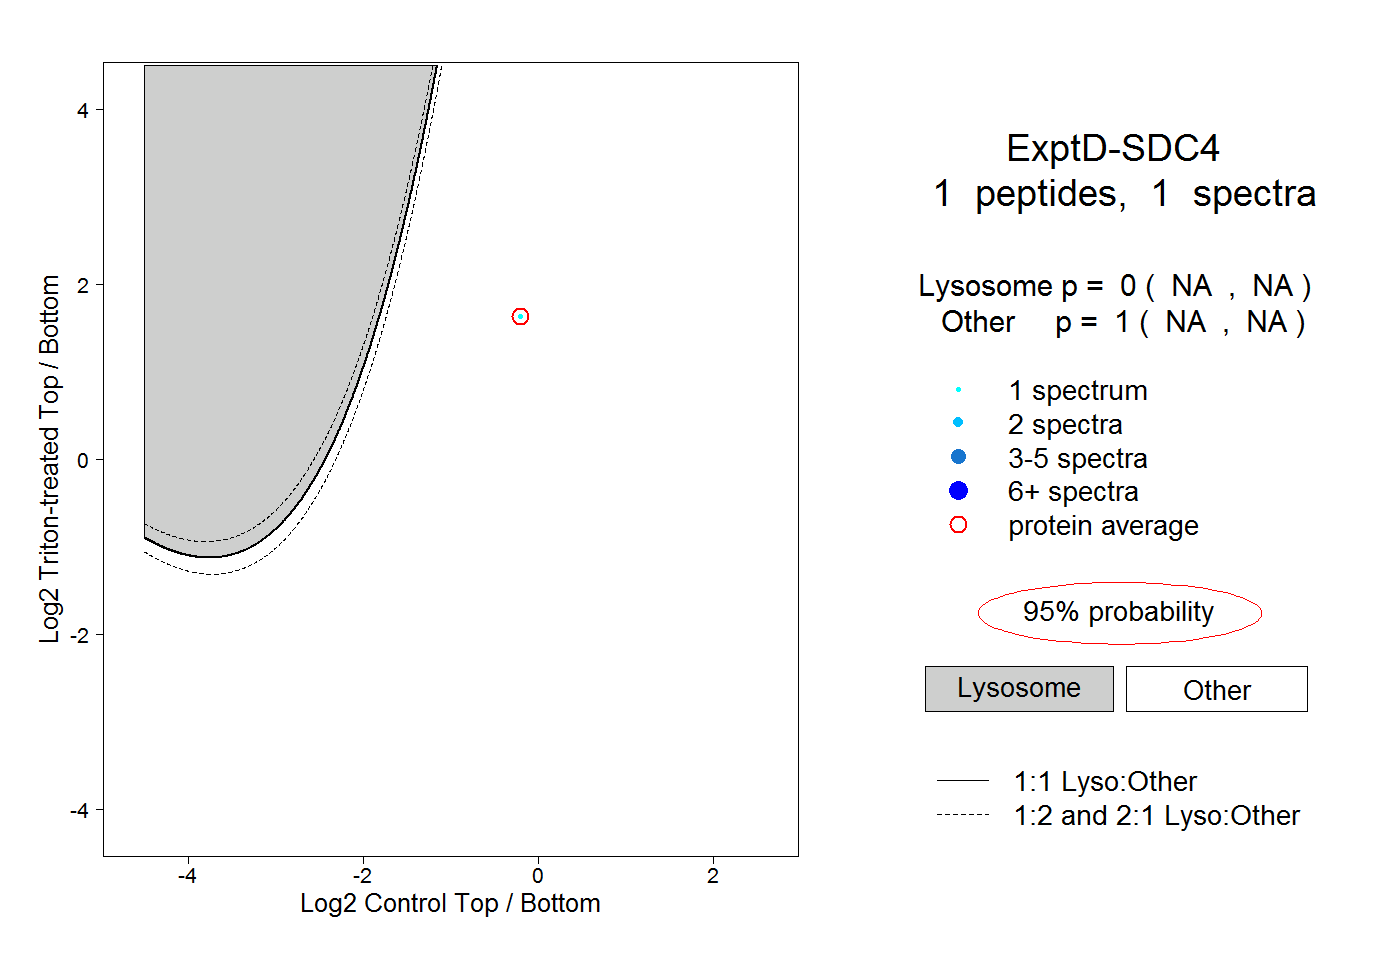 |
0.000 NA | NA |
1.000 NA | NA |