 4
4peptides
spectra
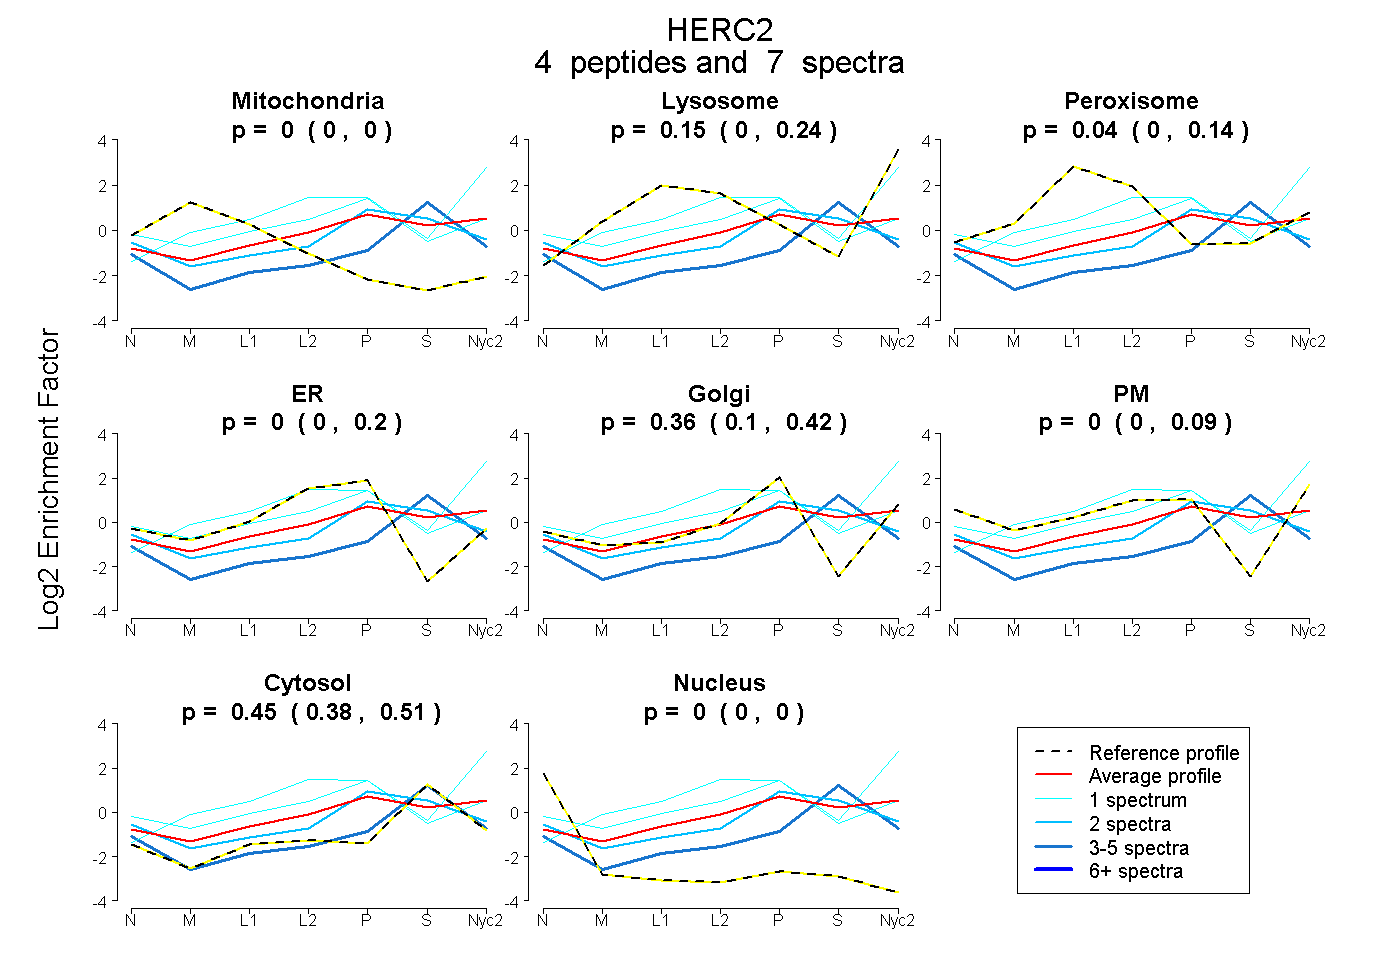
0.000 | 0.000
0.000 | 0.244
0.000 | 0.137
0.000 | 0.196
0.100 | 0.424
0.000 | 0.090
0.383 | 0.511
0.000 | 0.000
1peptide
spectra
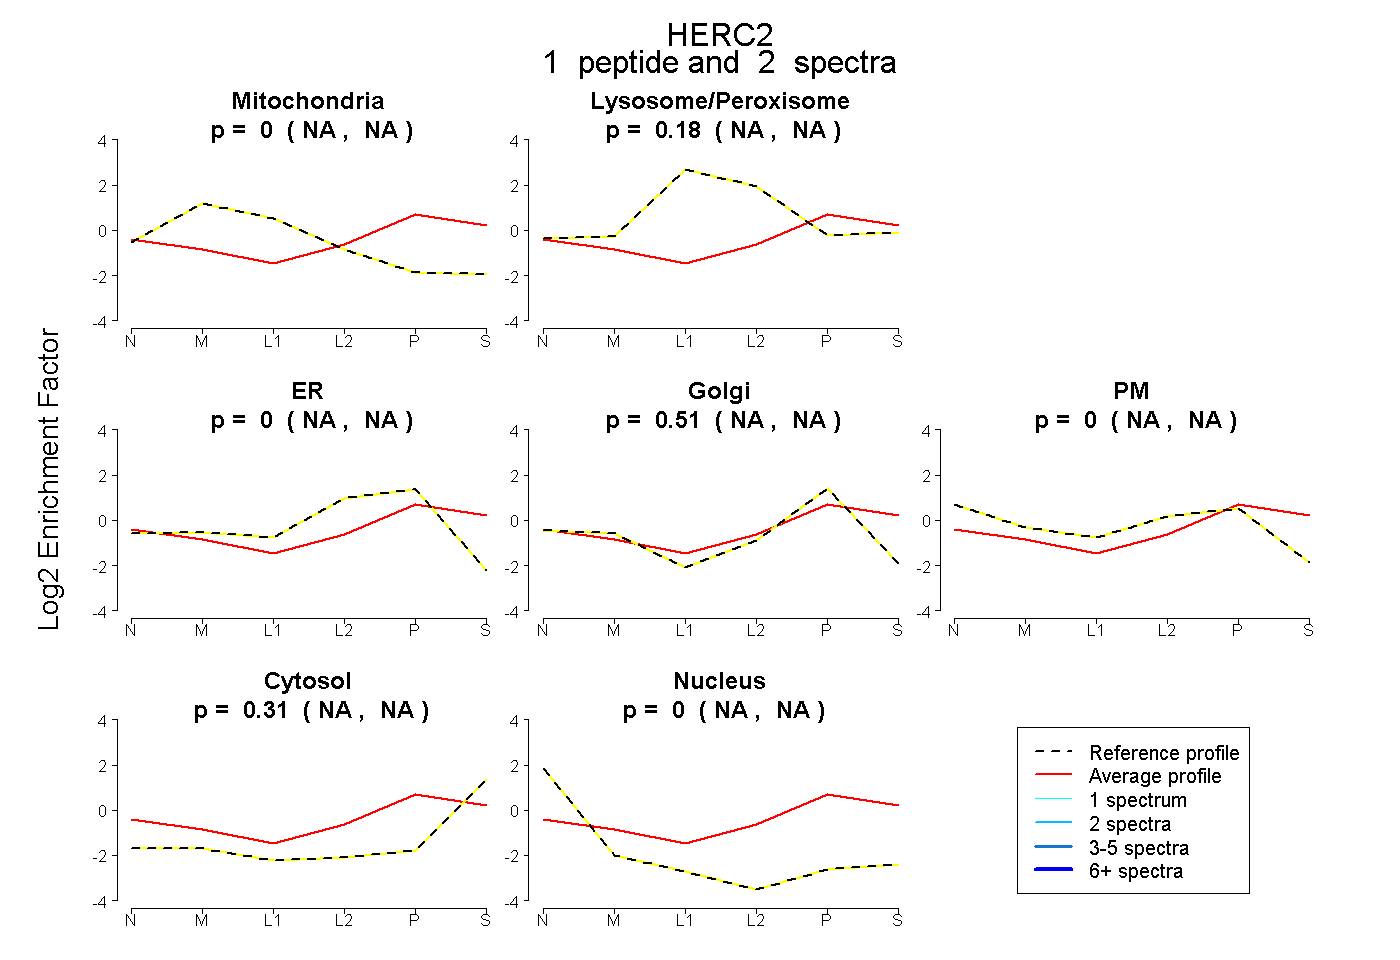
NA | NA
NA | NA
NA | NA
NA | NA
NA | NA
NA | NA
NA | NA
3peptides
spectra
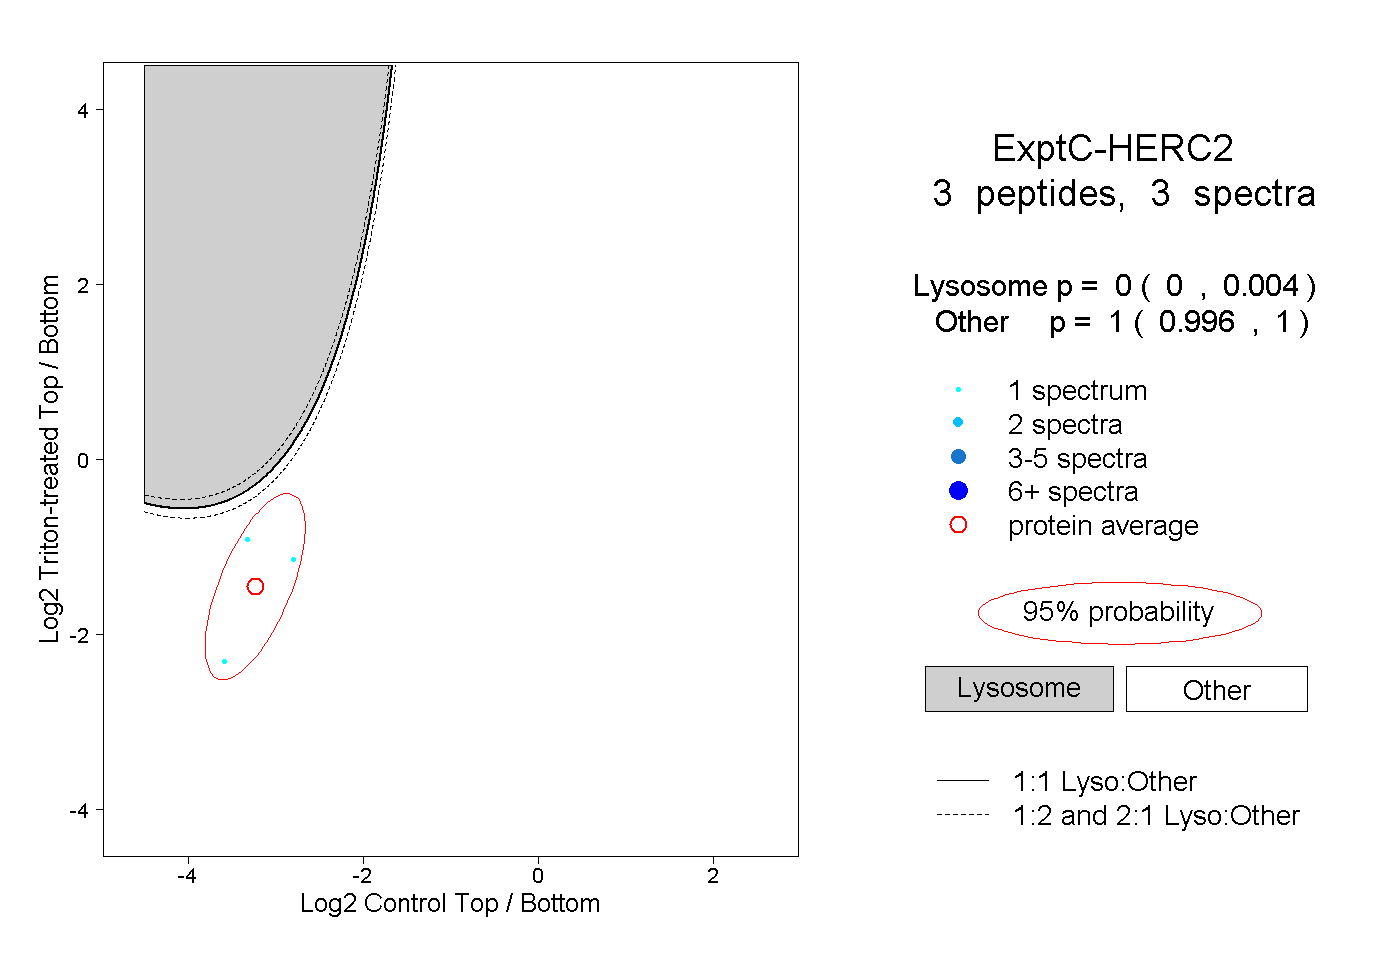
0.000 | 0.004
0.996 | 1.000