 4
4peptides
spectra
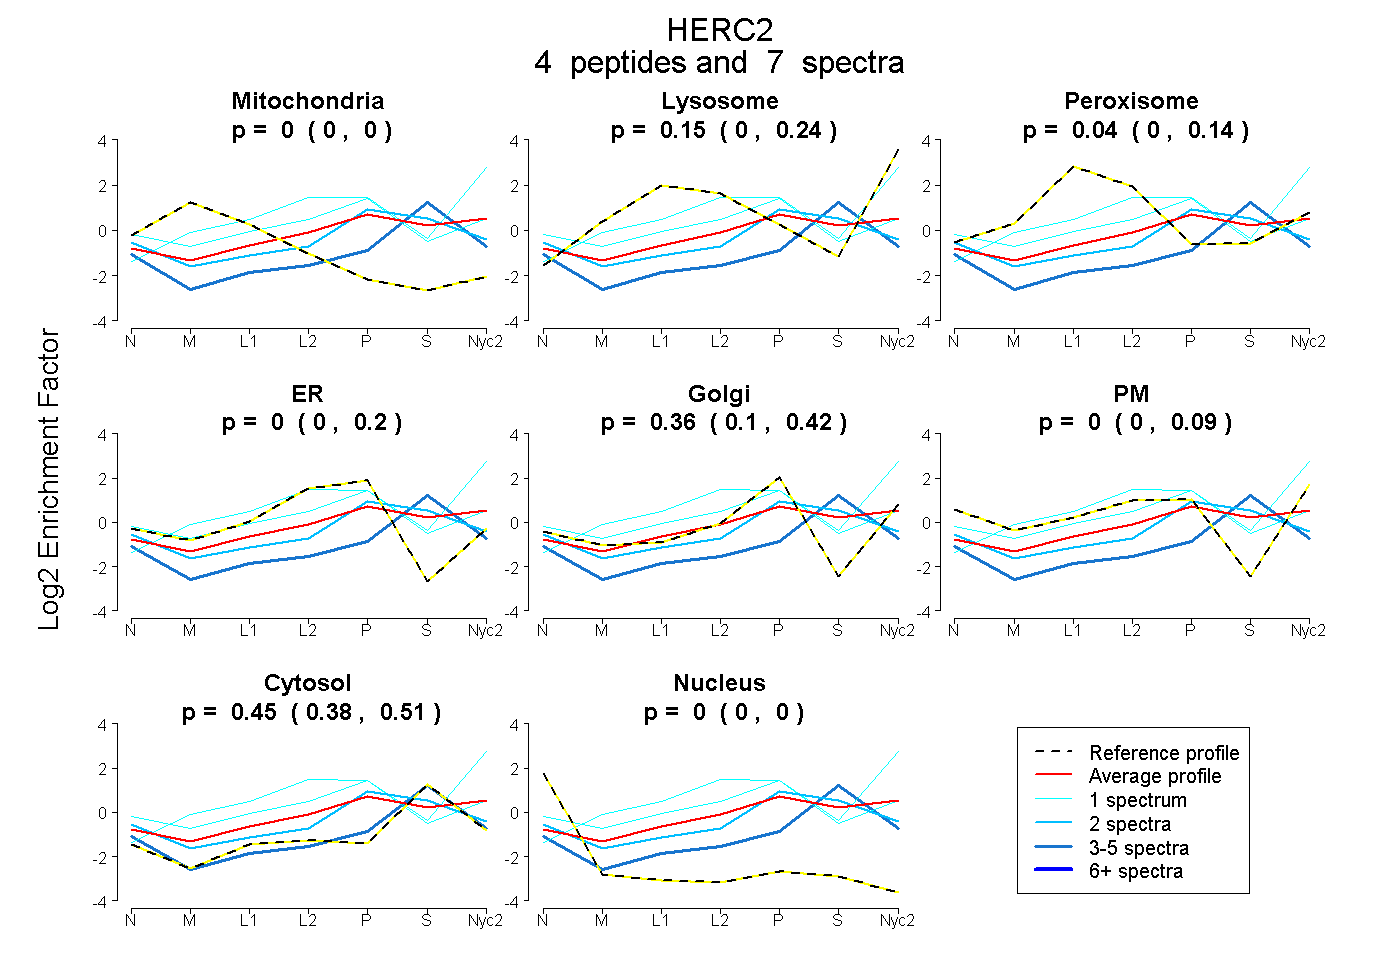
0.000 | 0.000
0.000 | 0.244
0.000 | 0.137
0.000 | 0.196
0.100 | 0.424
0.000 | 0.090
0.383 | 0.511
0.000 | 0.000
| Plot | Mito | Lyso | Perox | ER | Golgi | PM | Cytosol | Nucleus | |||||
| Expt A |
4 peptides |
7 spectra |
|
0.000 0.000 | 0.000 |
0.155 0.000 | 0.244 |
0.036 0.000 | 0.137 |
0.000 0.000 | 0.196 |
0.360 0.100 | 0.424 |
0.000 0.000 | 0.090 |
0.449 0.383 | 0.511 |
0.000 0.000 | 0.000 |
| 1 spectrum, ILLSLEGNLAK | 0.000 | 0.670 | 0.000 | 0.000 | 0.257 | 0.000 | 0.073 | 0.000 | ||
| 2 spectra, VLLGHR | 0.000 | 0.000 | 0.000 | 0.049 | 0.386 | 0.000 | 0.565 | 0.000 | ||
| 1 spectrum, LVEALQGHR | 0.000 | 0.000 | 0.274 | 0.004 | 0.564 | 0.000 | 0.158 | 0.000 | ||
| 3 spectra, ILEALK | 0.000 | 0.000 | 0.000 | 0.000 | 0.047 | 0.000 | 0.923 | 0.031 |
| Plot | Mito | Lyso or Perox | ER | Golgi | PM | Cytosol | Nucleus | ||||||
| Expt B |
1 peptide |
2 spectra |
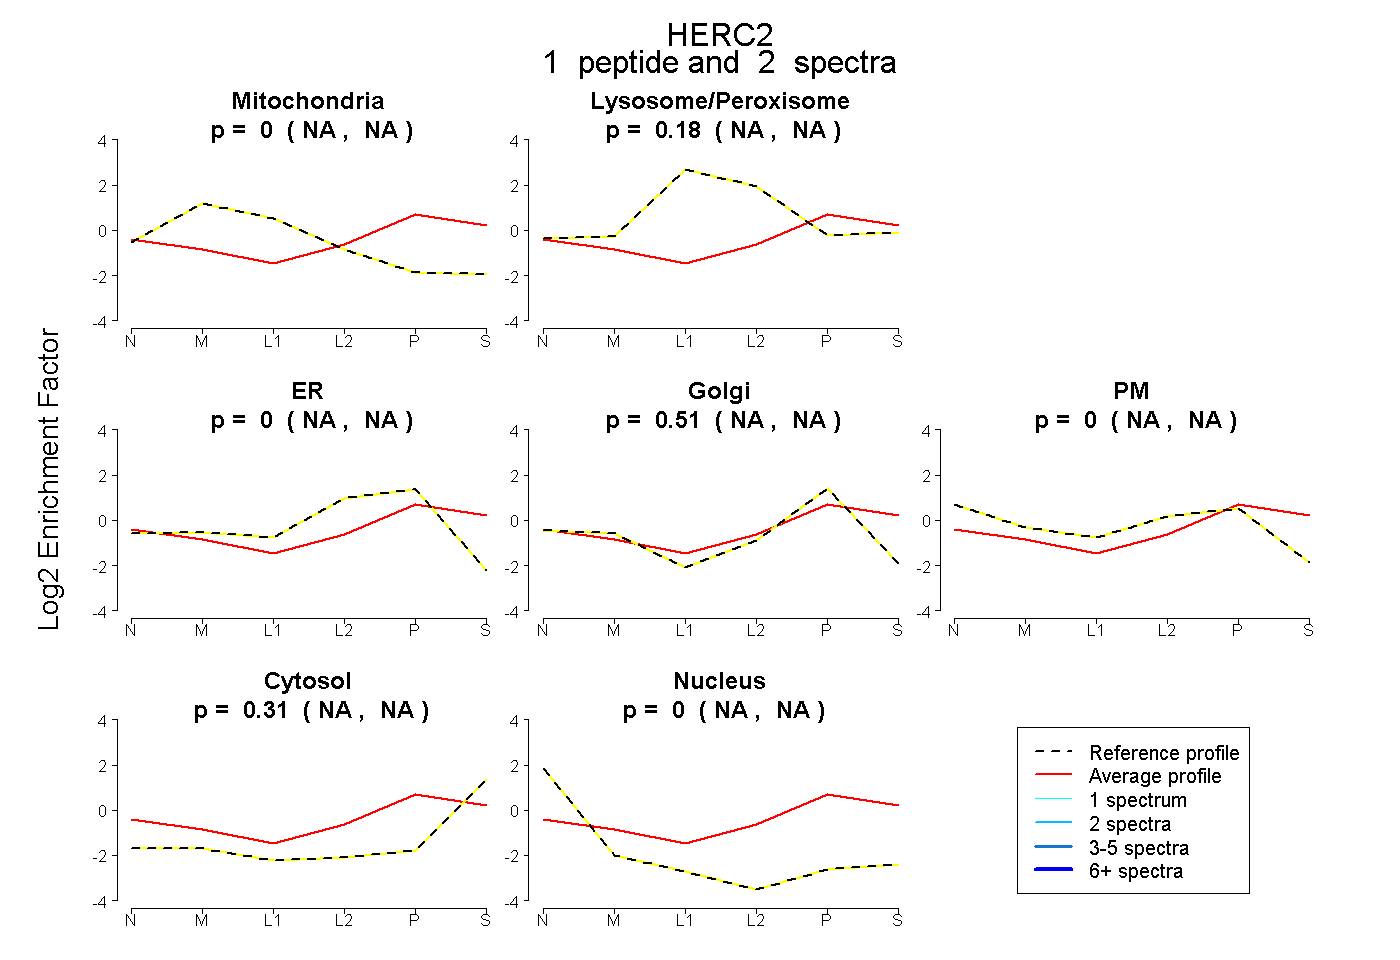 |
0.000 NA | NA |
0.177 NA | NA |
0.000 NA | NA |
0.508 NA | NA |
0.000 NA | NA |
0.314 NA | NA |
0.000 NA | NA |
|||
| Plot | Lyso | Other | |||||||||||
| Expt C |
3 peptides |
3 spectra |
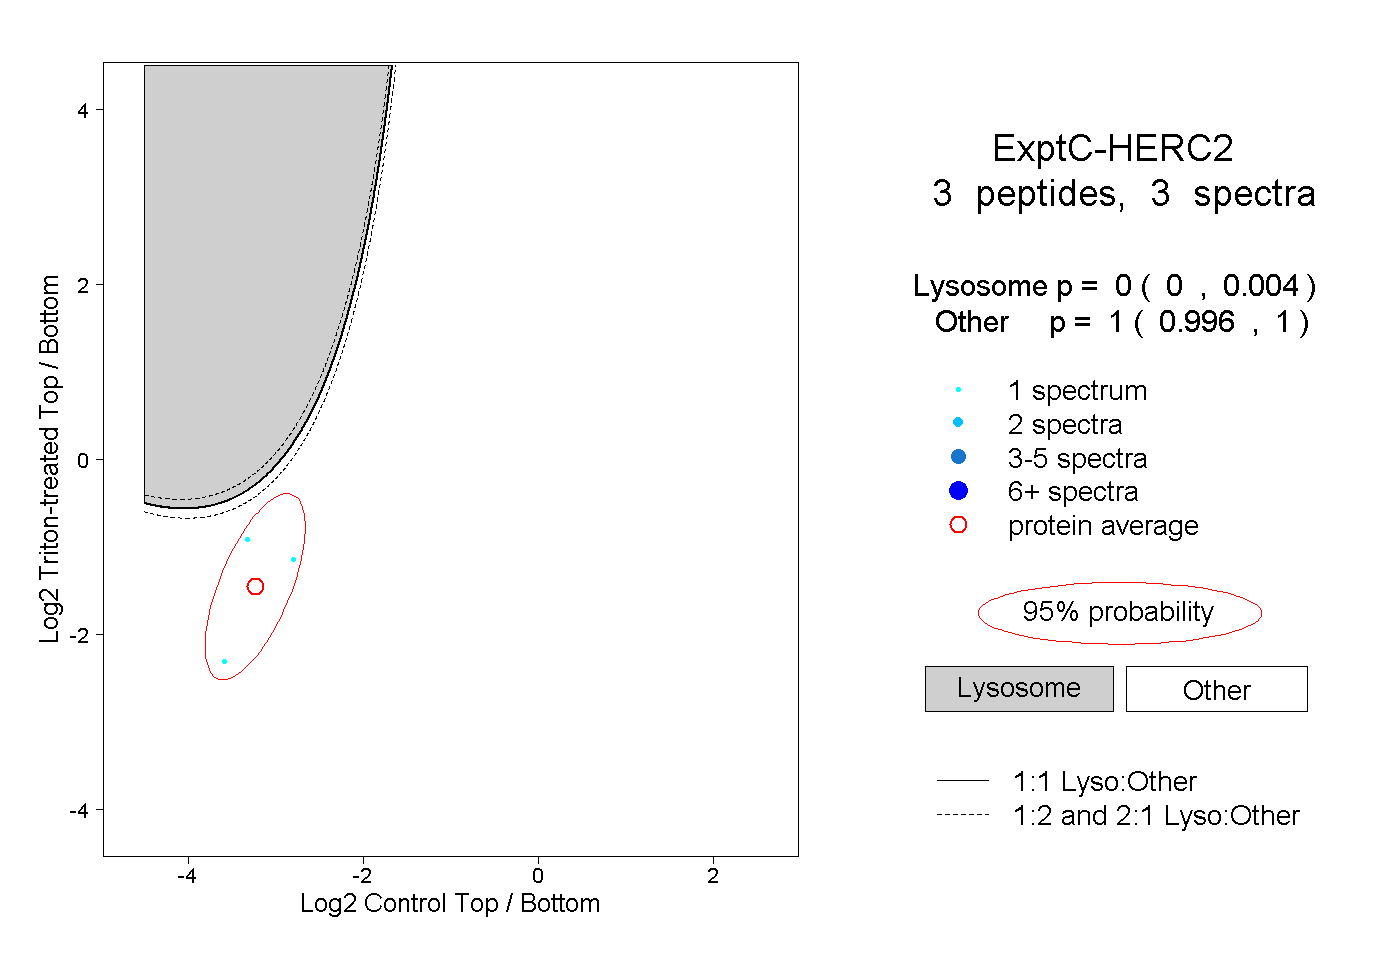 |
0.000 0.000 | 0.004 |
1.000 0.996 | 1.000 |