 7
7peptides
spectra
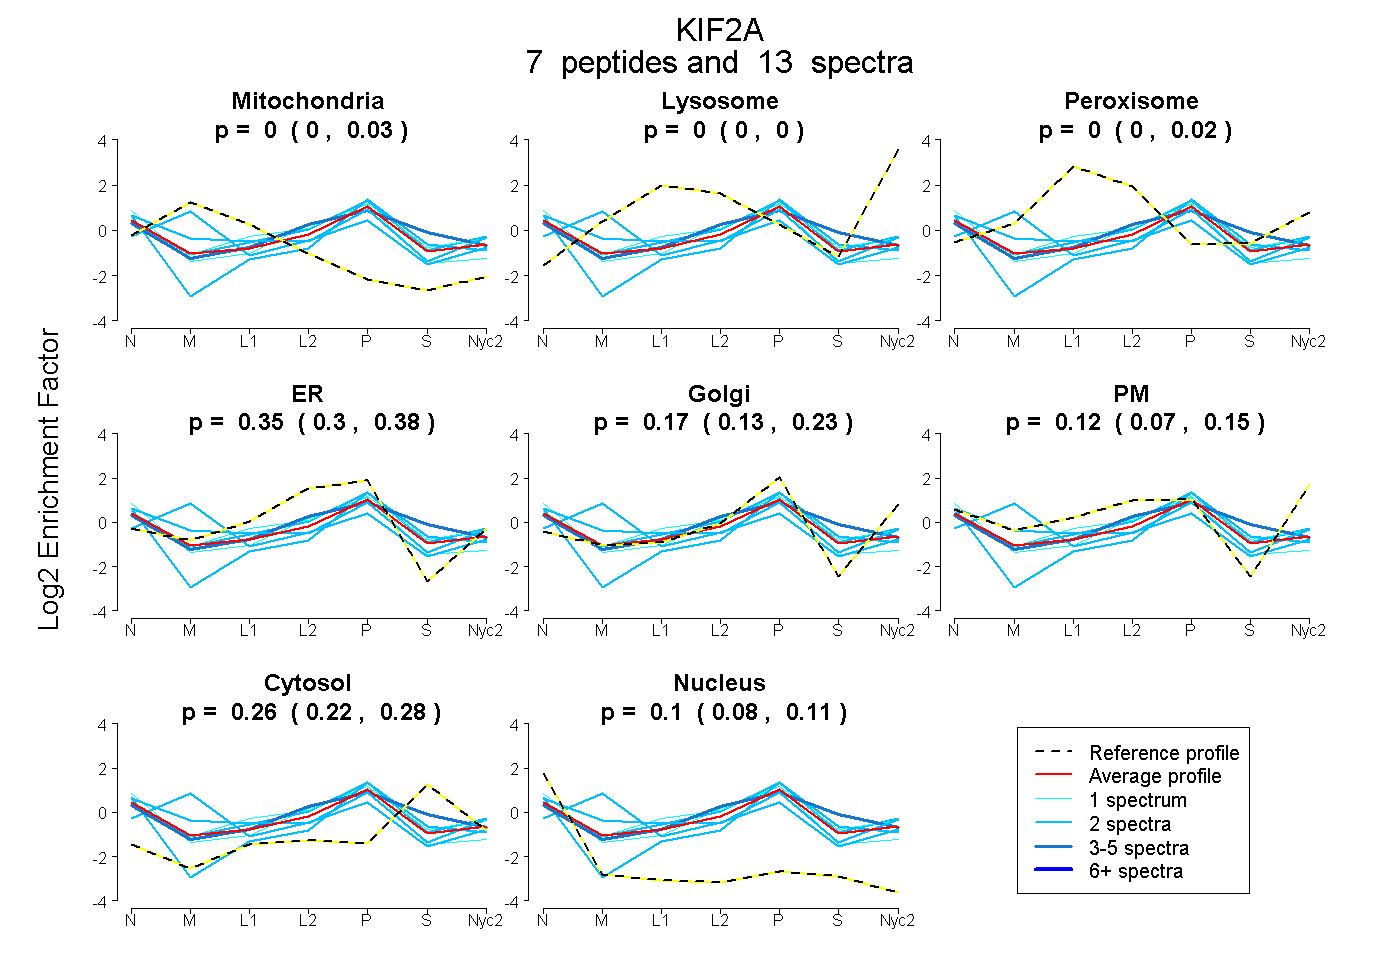
0.000 | 0.027
0.000 | 0.000
0.000 | 0.025
0.297 | 0.378
0.131 | 0.231
0.068 | 0.149
0.225 | 0.276
0.079 | 0.112
1peptide
spectrum
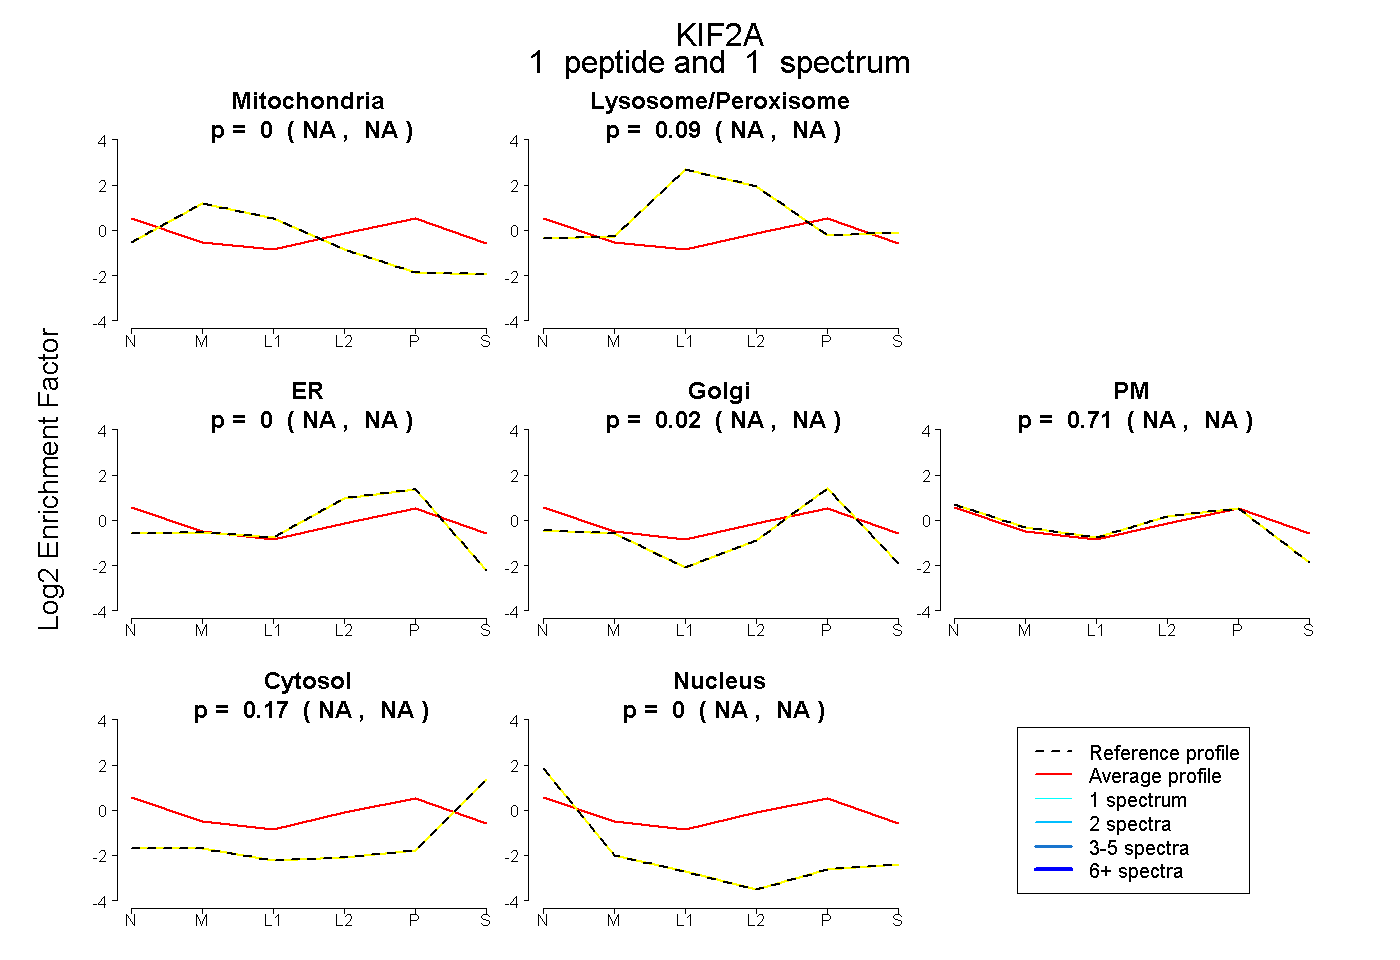
NA | NA
NA | NA
NA | NA
NA | NA
NA | NA
NA | NA
NA | NA
1peptide
spectrum
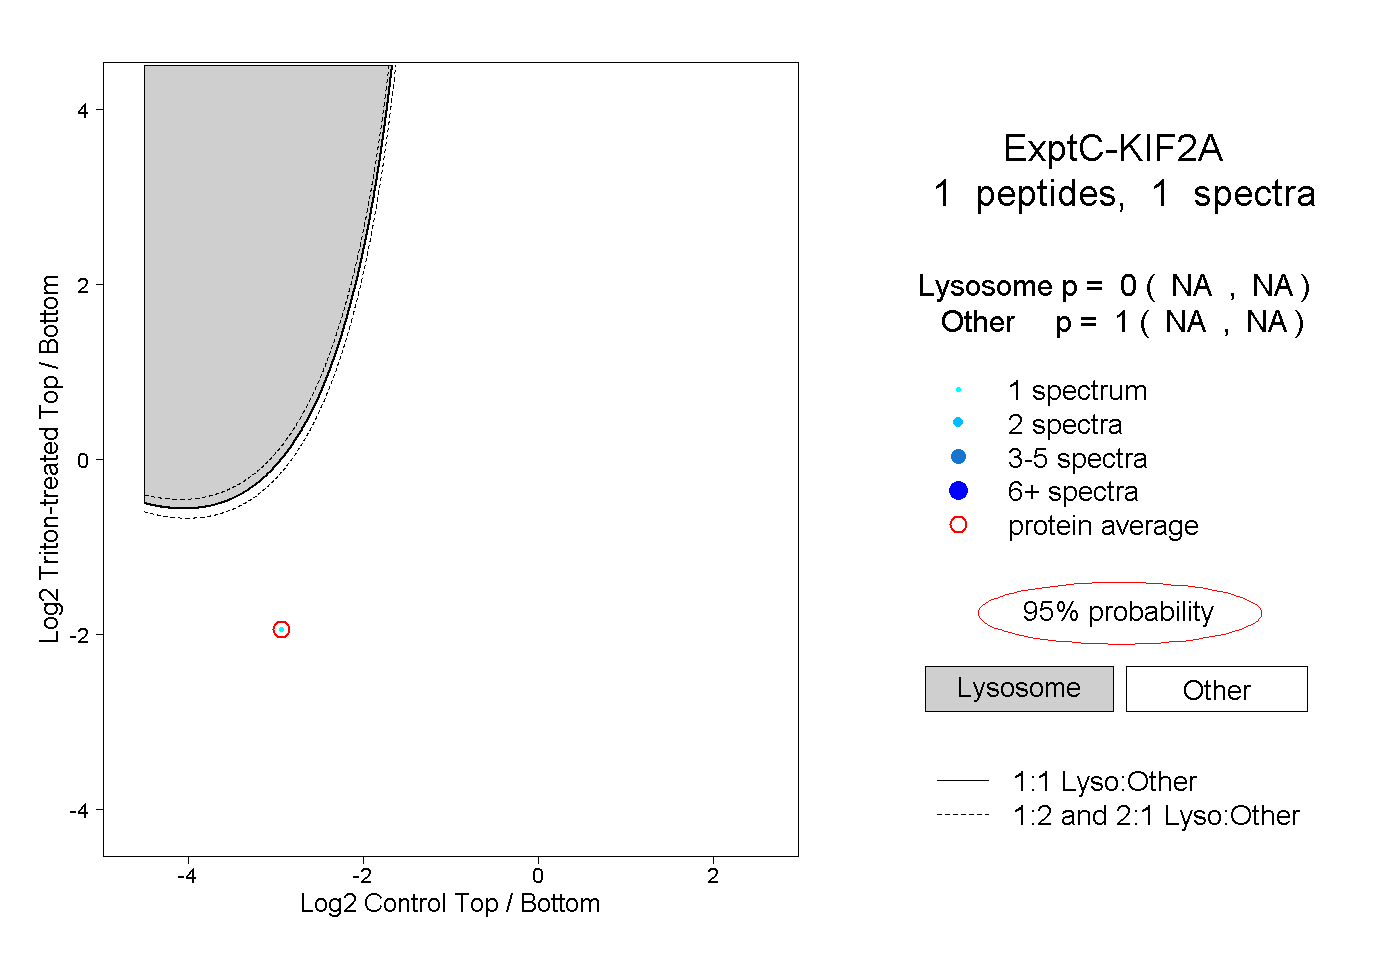
NA | NA
NA | NA