 7
7peptides
spectra
0.000 | 0.027
0.000 | 0.000
0.000 | 0.025
0.297 | 0.378
0.131 | 0.231
0.068 | 0.149
0.225 | 0.276
0.079 | 0.112
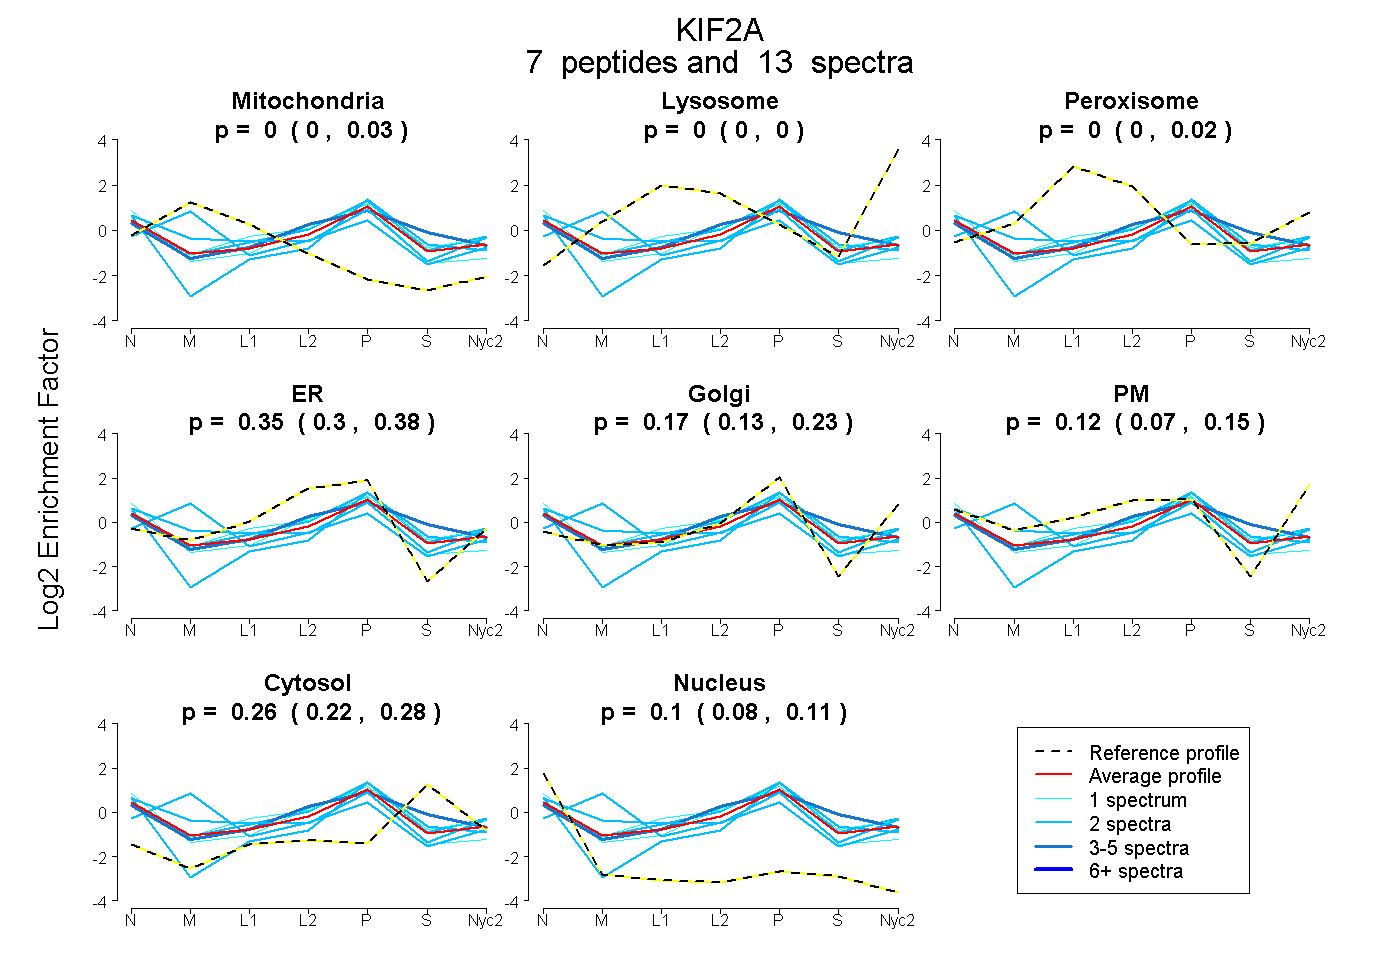
| Plot | Mito | Lyso | Perox | ER | Golgi | PM | Cytosol | Nucleus | |||||
| Expt A |
7 peptides |
13 spectra |
|
0.000 0.000 | 0.027 |
0.000 0.000 | 0.000 |
0.000 0.000 | 0.025 |
0.348 0.297 | 0.378 |
0.171 0.131 | 0.231 |
0.122 0.068 | 0.149 |
0.258 0.225 | 0.276 |
0.100 0.079 | 0.112 |
| 2 spectra, NKPHTPFR | 0.429 | 0.000 | 0.000 | 0.000 | 0.494 | 0.000 | 0.077 | 0.000 | ||
| 2 spectra, GSLDYRPLTTADPIDEHR | 0.000 | 0.000 | 0.000 | 0.343 | 0.205 | 0.157 | 0.261 | 0.035 | ||
| 1 spectrum, GADTSSADR | 0.000 | 0.000 | 0.000 | 0.630 | 0.030 | 0.000 | 0.135 | 0.205 | ||
| 1 spectrum, ICVCVR | 0.000 | 0.000 | 0.022 | 0.384 | 0.054 | 0.216 | 0.282 | 0.042 | ||
| 2 spectra, IDILTELR | 0.000 | 0.000 | 0.000 | 0.073 | 0.450 | 0.000 | 0.315 | 0.162 | ||
| 3 spectra, SHAVFQIILR | 0.000 | 0.000 | 0.000 | 0.455 | 0.000 | 0.094 | 0.442 | 0.009 | ||
| 2 spectra, WIEDEK | 0.115 | 0.000 | 0.106 | 0.000 | 0.468 | 0.131 | 0.067 | 0.113 |
| Plot | Mito | Lyso or Perox | ER | Golgi | PM | Cytosol | Nucleus | ||||||
| Expt B |
1 peptide |
1 spectrum |
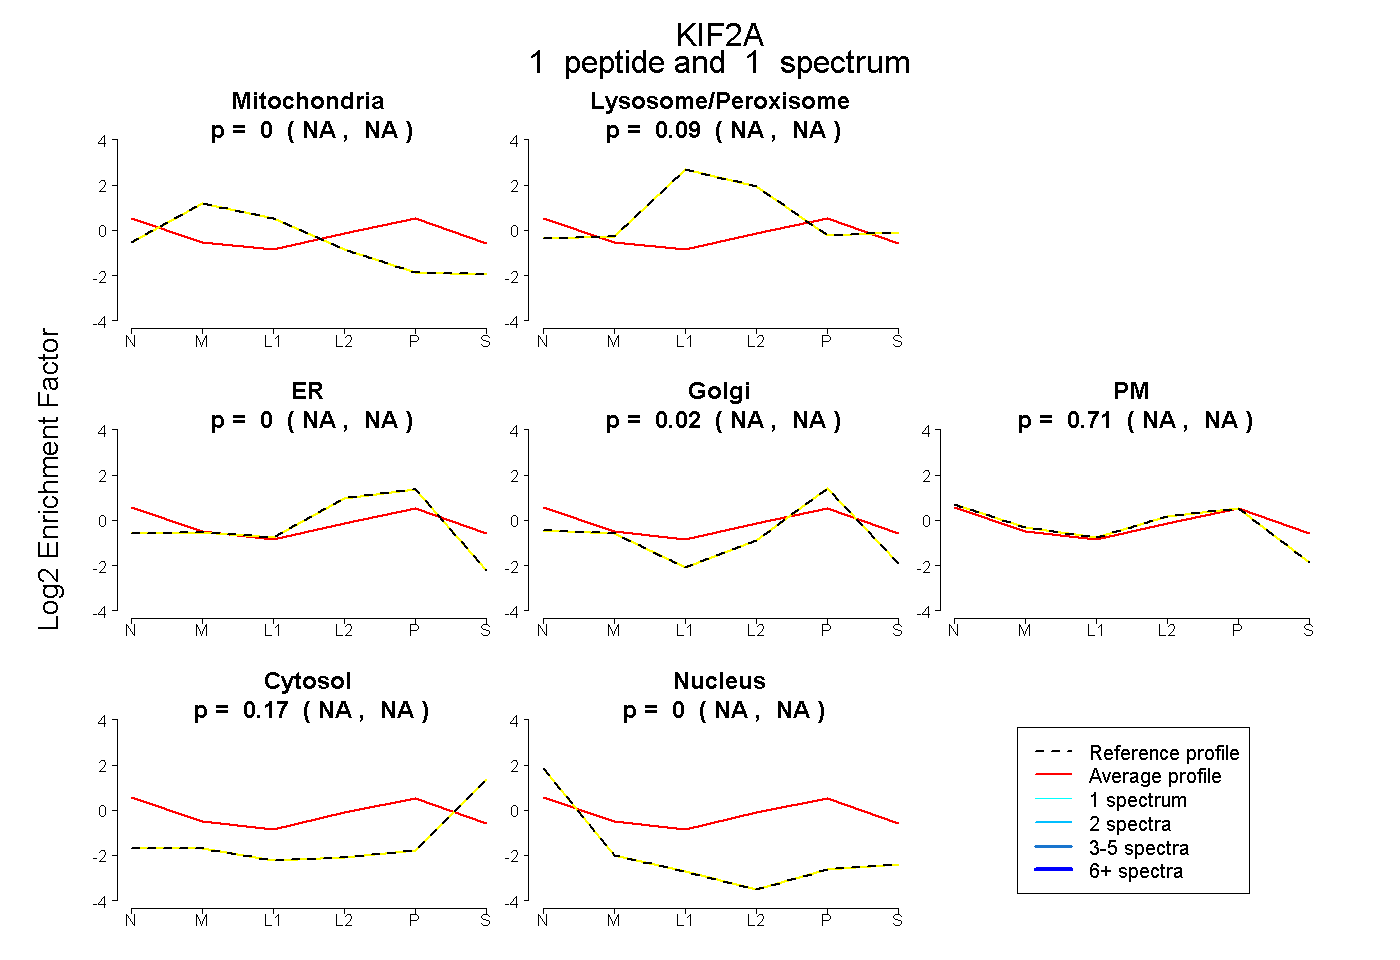 |
0.000 NA | NA |
0.088 NA | NA |
0.000 NA | NA |
0.023 NA | NA |
0.714 NA | NA |
0.175 NA | NA |
0.000 NA | NA |
|||
| Plot | Lyso | Other | |||||||||||
| Expt C |
1 peptide |
1 spectrum |
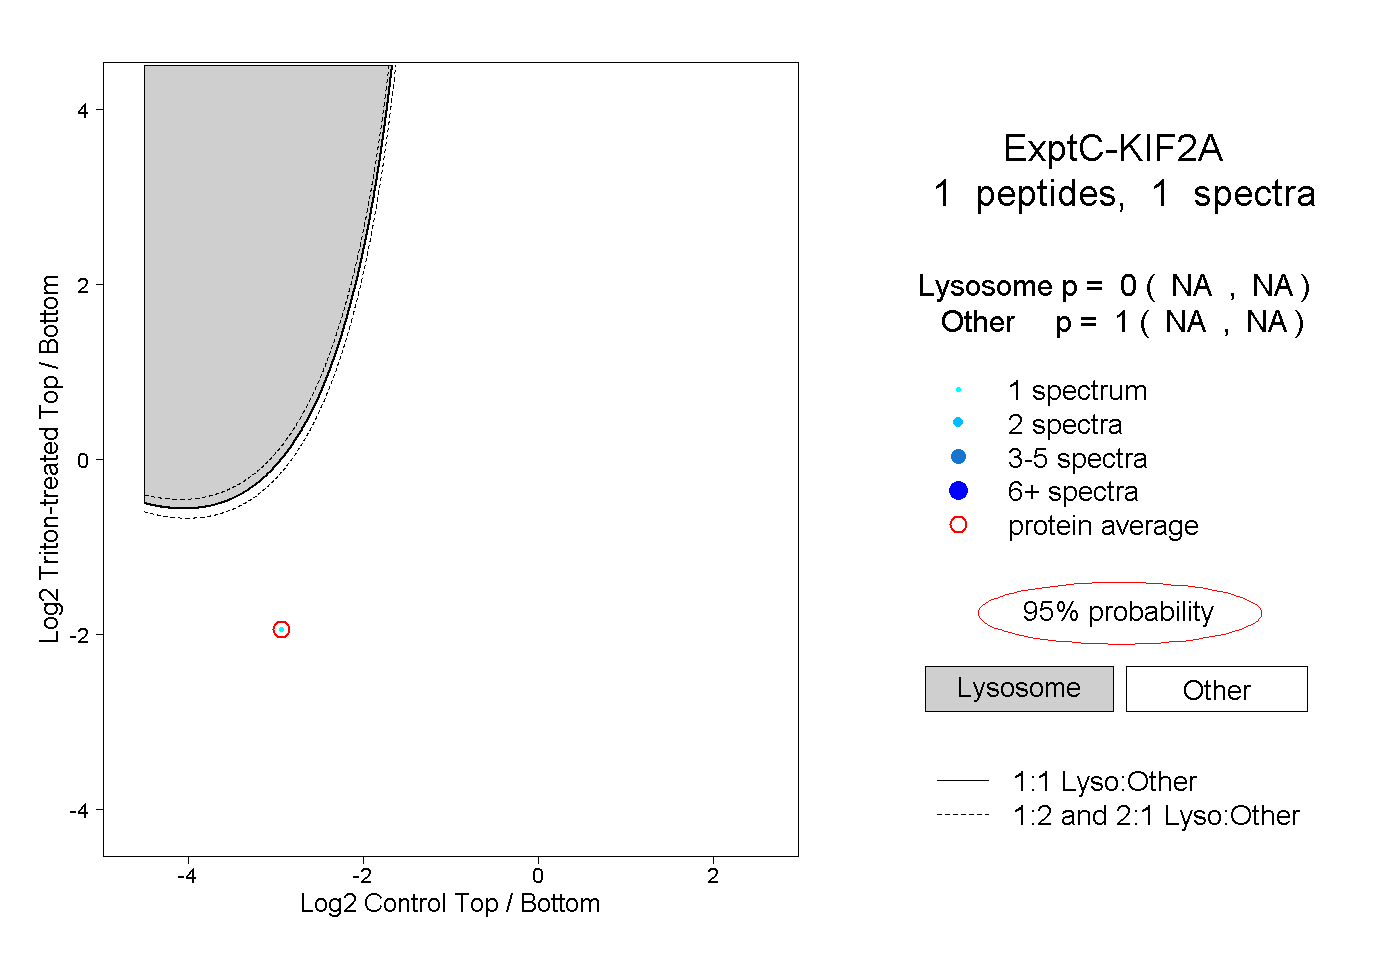 |
0.000 NA | NA |
1.000 NA | NA |