 14
14peptides
spectra
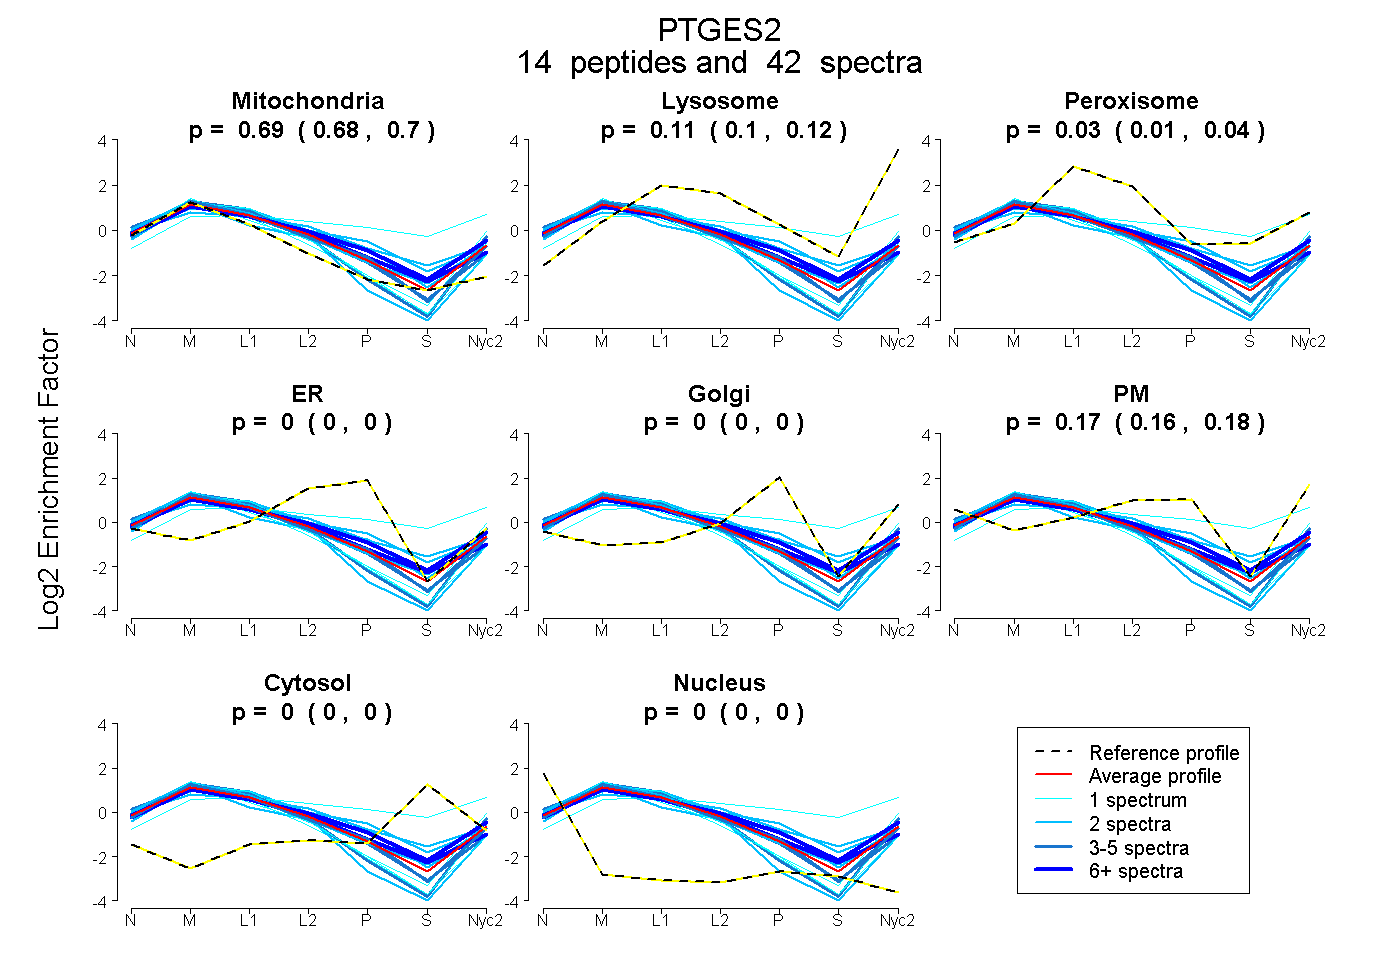
0.684 | 0.698
0.103 | 0.121
0.013 | 0.039
0.000 | 0.000
0.000 | 0.000
0.155 | 0.177
0.000 | 0.000
0.000 | 0.000
6peptides
spectra
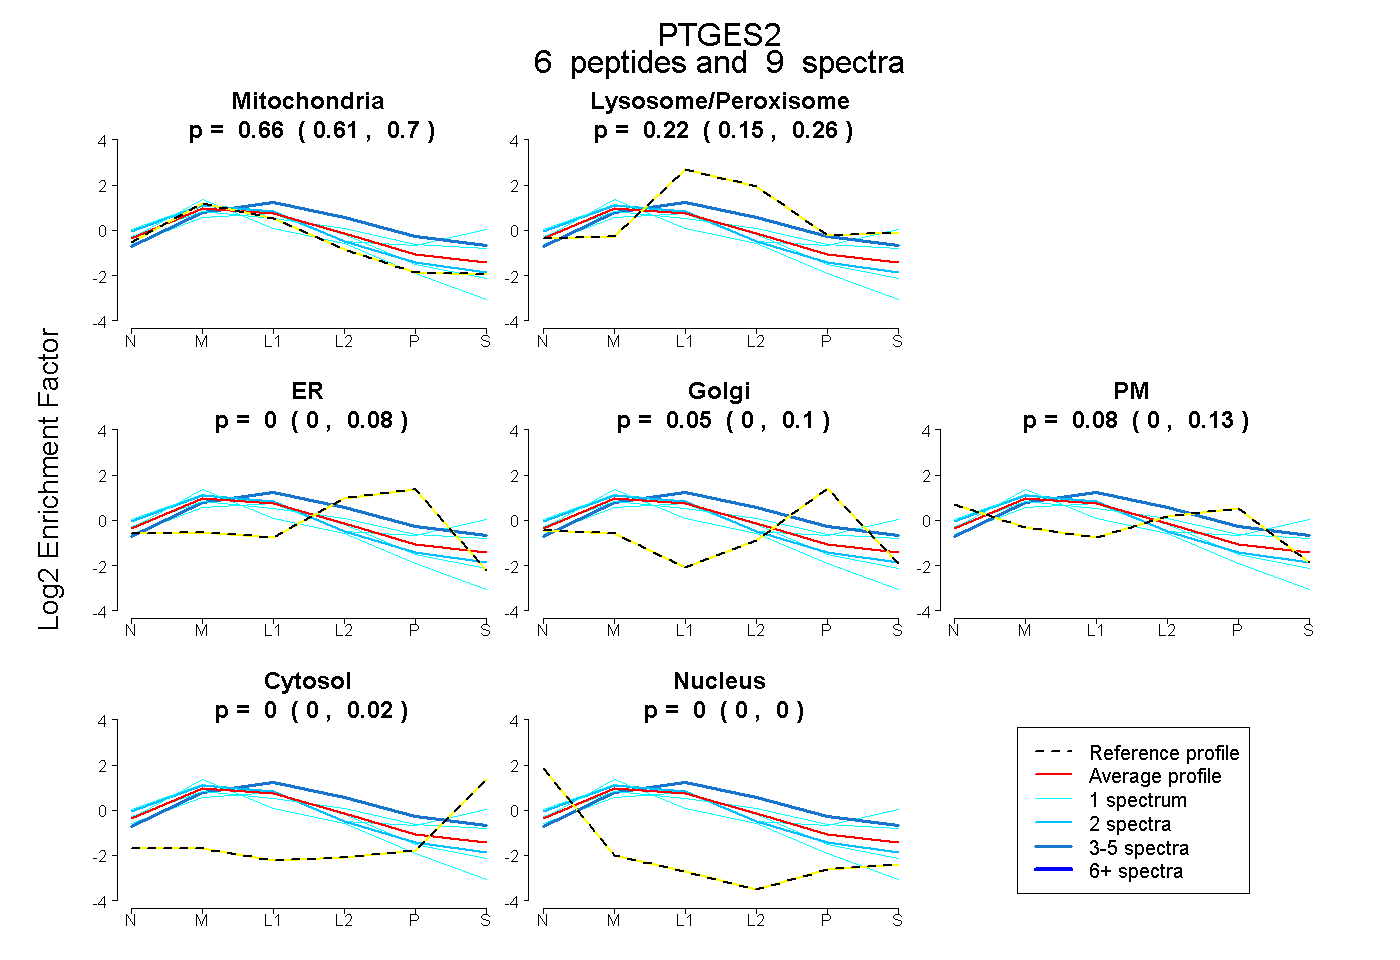
0.608 | 0.704
0.155 | 0.257
0.000 | 0.078
0.000 | 0.096
0.000 | 0.130
0.000 | 0.023
0.000 | 0.000
16peptides
spectra
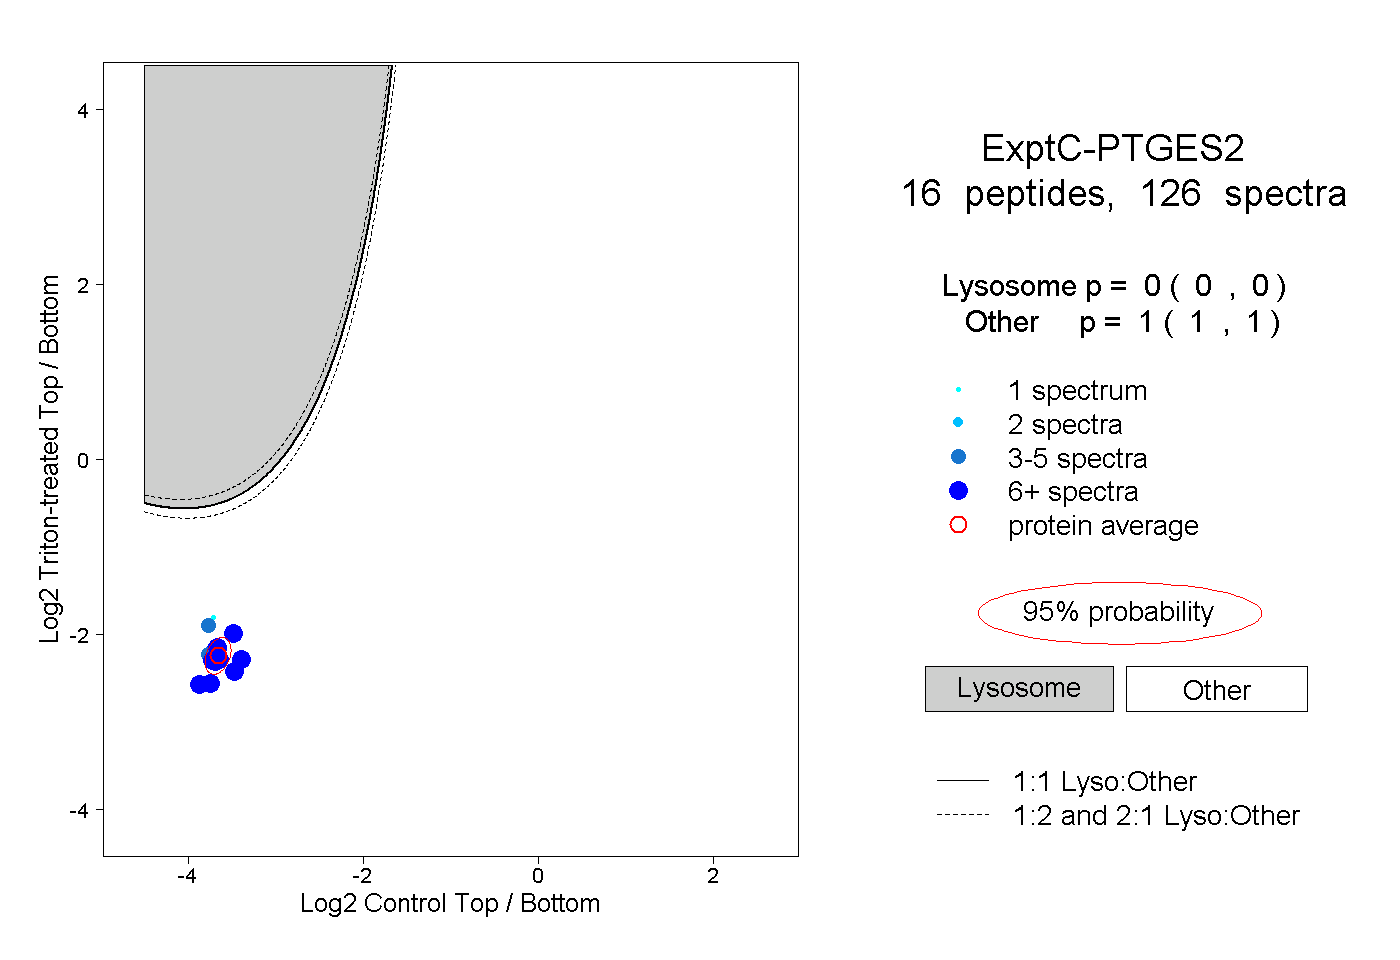
0.000 | 0.000
1.000 | 1.000
8peptides
spectra
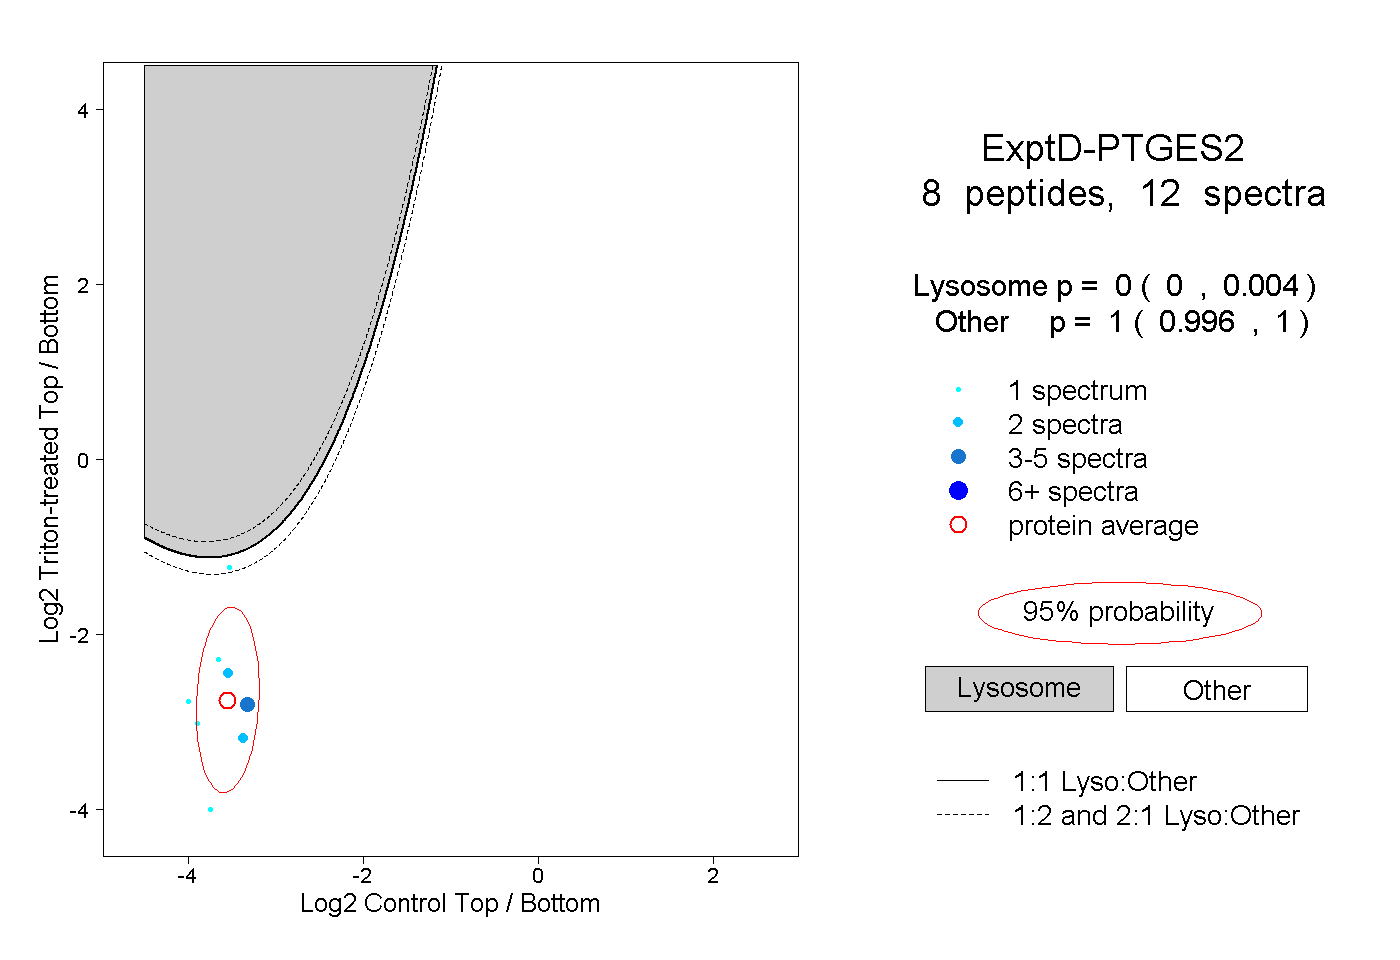
0.000 | 0.004
0.996 | 1.000