 14
14peptides
spectra
0.684 | 0.698
0.103 | 0.121
0.013 | 0.039
0.000 | 0.000
0.000 | 0.000
0.155 | 0.177
0.000 | 0.000
0.000 | 0.000
| Plot | Mito | Lyso | Perox | ER | Golgi | PM | Cytosol | Nucleus | |||||
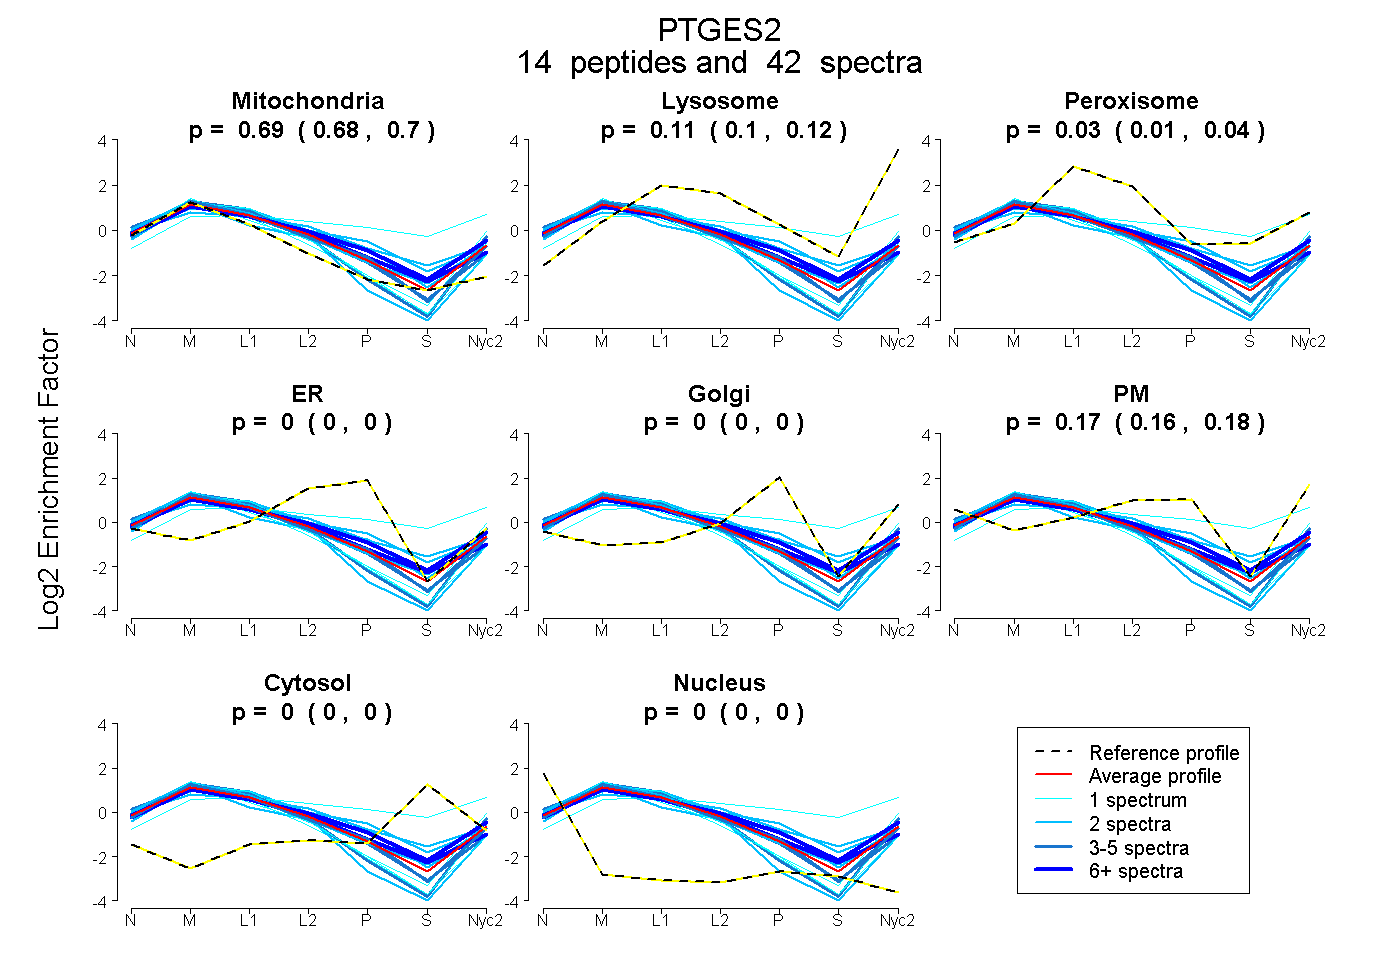
| Expt A |
14 peptides |
42 spectra |
|
0.691 0.684 | 0.698 |
0.113 0.103 | 0.121 |
0.028 0.013 | 0.039 |
0.000 0.000 | 0.000 |
0.000 0.000 | 0.000 |
0.168 0.155 | 0.177 |
0.000 0.000 | 0.000 |
0.000 0.000 | 0.000 |
| 1 spectrum, EVTEFGNK | 0.741 | 0.174 | 0.000 | 0.000 | 0.000 | 0.086 | 0.000 | 0.000 | ||
| 3 spectra, SAVQLSLSNR | 0.729 | 0.000 | 0.065 | 0.000 | 0.000 | 0.206 | 0.000 | 0.000 | ||
| 9 spectra, VMEGLEAFDDLMR | 0.599 | 0.124 | 0.072 | 0.034 | 0.000 | 0.171 | 0.000 | 0.000 | ||
| 5 spectra, DRPFMGGQKPNLADLAVYGVLR | 0.765 | 0.156 | 0.000 | 0.000 | 0.000 | 0.079 | 0.000 | 0.000 | ||
| 7 spectra, YVGAAAMYFISK | 0.669 | 0.015 | 0.138 | 0.037 | 0.000 | 0.141 | 0.000 | 0.000 | ||
| 2 spectra, VDLYEAANK | 0.895 | 0.065 | 0.000 | 0.000 | 0.000 | 0.040 | 0.000 | 0.000 | ||
| 1 spectrum, FGAVEATMAK | 0.144 | 0.252 | 0.267 | 0.000 | 0.150 | 0.000 | 0.187 | 0.000 | ||
| 2 spectra, HHLQDDVR | 0.479 | 0.000 | 0.248 | 0.058 | 0.003 | 0.153 | 0.060 | 0.000 | ||
| 1 spectrum, LQLTLYQYK | 0.780 | 0.105 | 0.000 | 0.000 | 0.000 | 0.115 | 0.000 | 0.000 | ||
| 2 spectra, EAQQMYGGK | 0.501 | 0.000 | 0.274 | 0.048 | 0.103 | 0.073 | 0.000 | 0.000 | ||
| 1 spectrum, WVTAVGK | 0.853 | 0.045 | 0.000 | 0.000 | 0.000 | 0.102 | 0.000 | 0.000 | ||
| 2 spectra, TPAEALASFDYIVR | 0.630 | 0.030 | 0.059 | 0.015 | 0.000 | 0.265 | 0.000 | 0.000 | ||
| 2 spectra, TCPFCSK | 0.731 | 0.154 | 0.000 | 0.000 | 0.023 | 0.092 | 0.000 | 0.000 | ||
| 4 spectra, YWLMLDQK | 0.717 | 0.099 | 0.000 | 0.000 | 0.000 | 0.184 | 0.000 | 0.000 |
| Plot | Mito | Lyso or Perox | ER | Golgi | PM | Cytosol | Nucleus | ||||||
| Expt B |
6 peptides |
9 spectra |
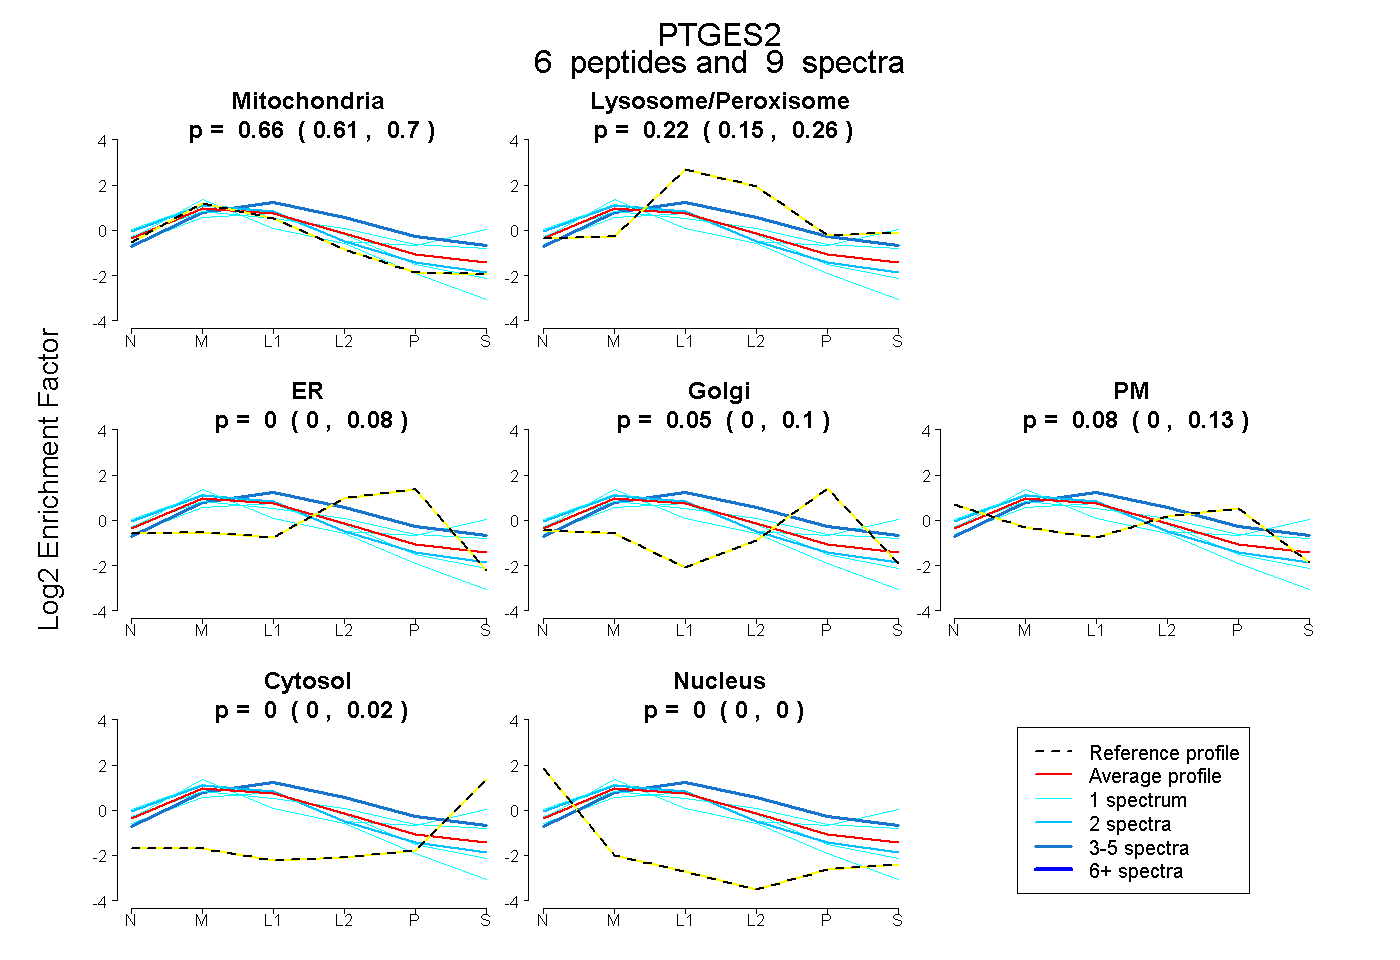 |
0.662 0.608 | 0.704 |
0.216 0.155 | 0.257 |
0.000 0.000 | 0.078 |
0.046 0.000 | 0.096 |
0.075 0.000 | 0.130 |
0.000 0.000 | 0.023 |
0.000 0.000 | 0.000 |
|||
| Plot | Lyso | Other | |||||||||||
| Expt C |
16 peptides |
126 spectra |
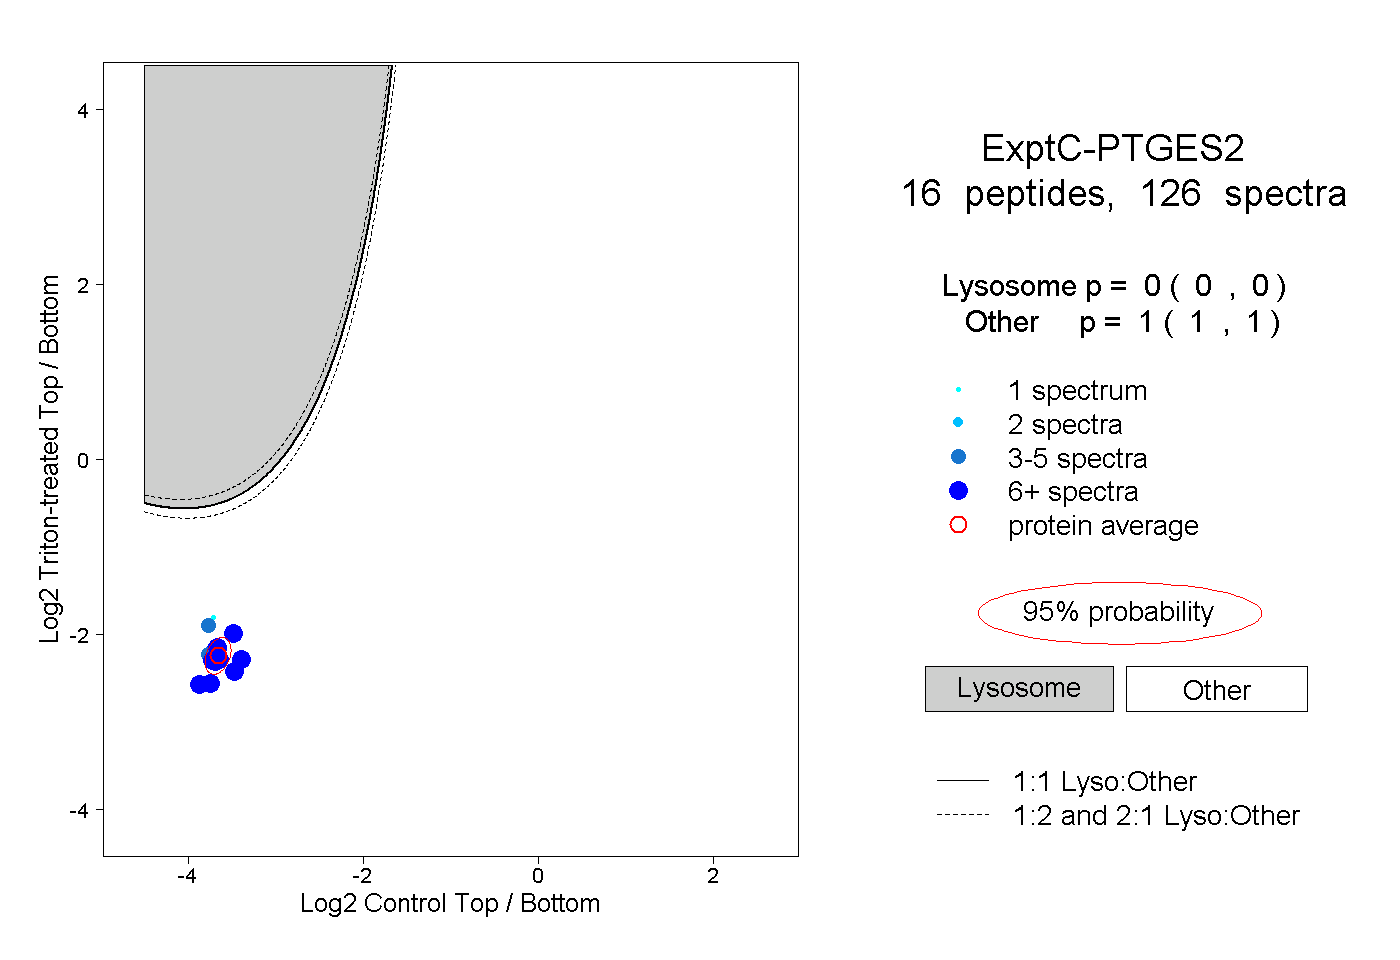 |
0.000 0.000 | 0.000 |
1.000 1.000 | 1.000 |
||||||||
| Plot | Lyso | Other | |||||||||||
| Expt D |
8 peptides |
12 spectra |
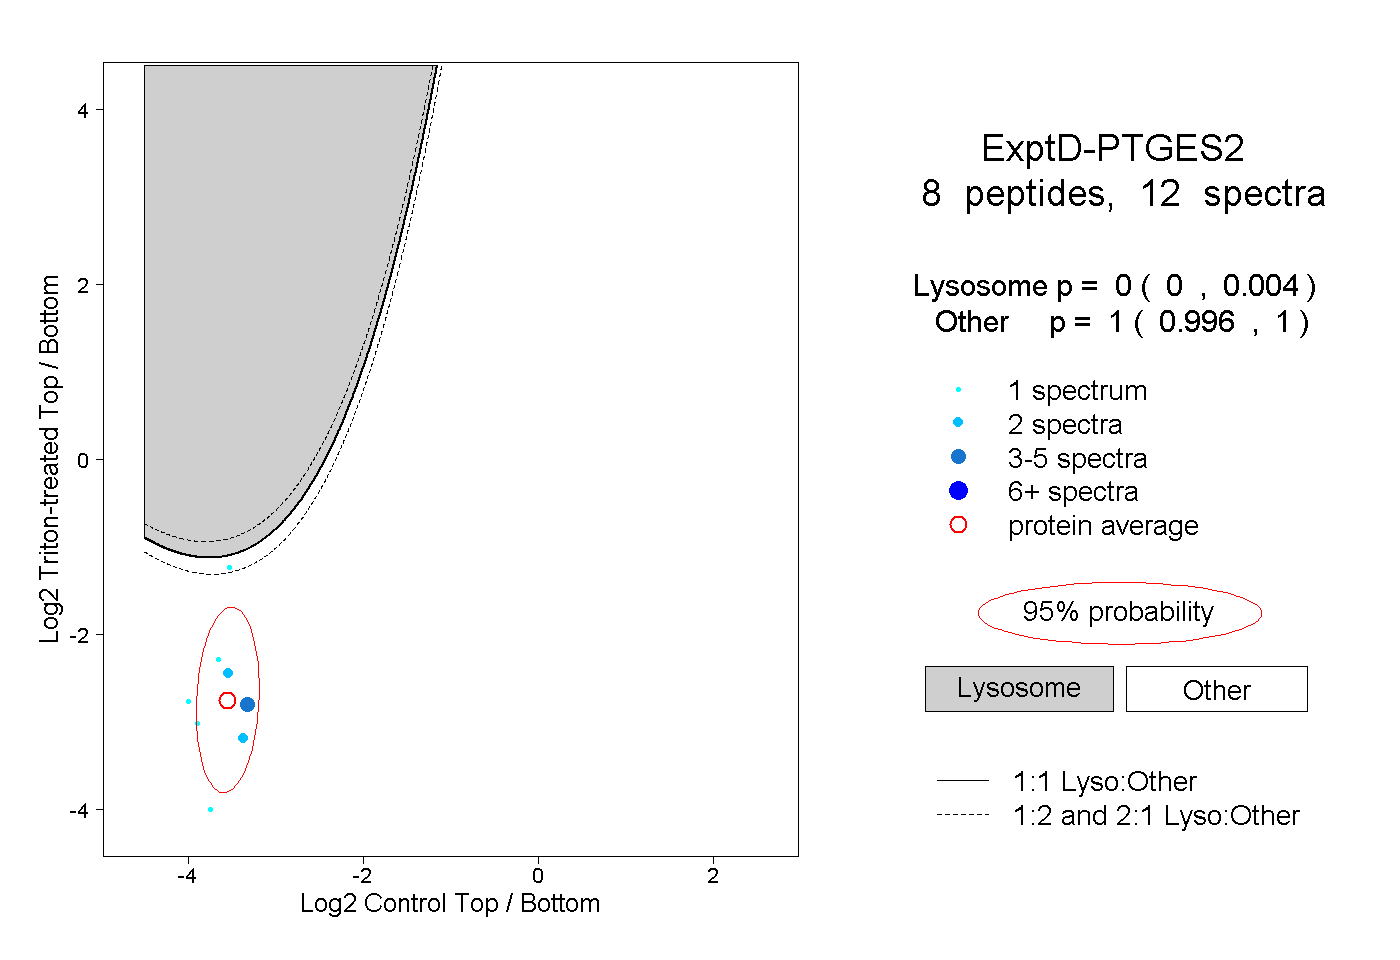 |
0.000 0.000 | 0.004 |
1.000 0.996 | 1.000 |