 5
5peptides
spectra
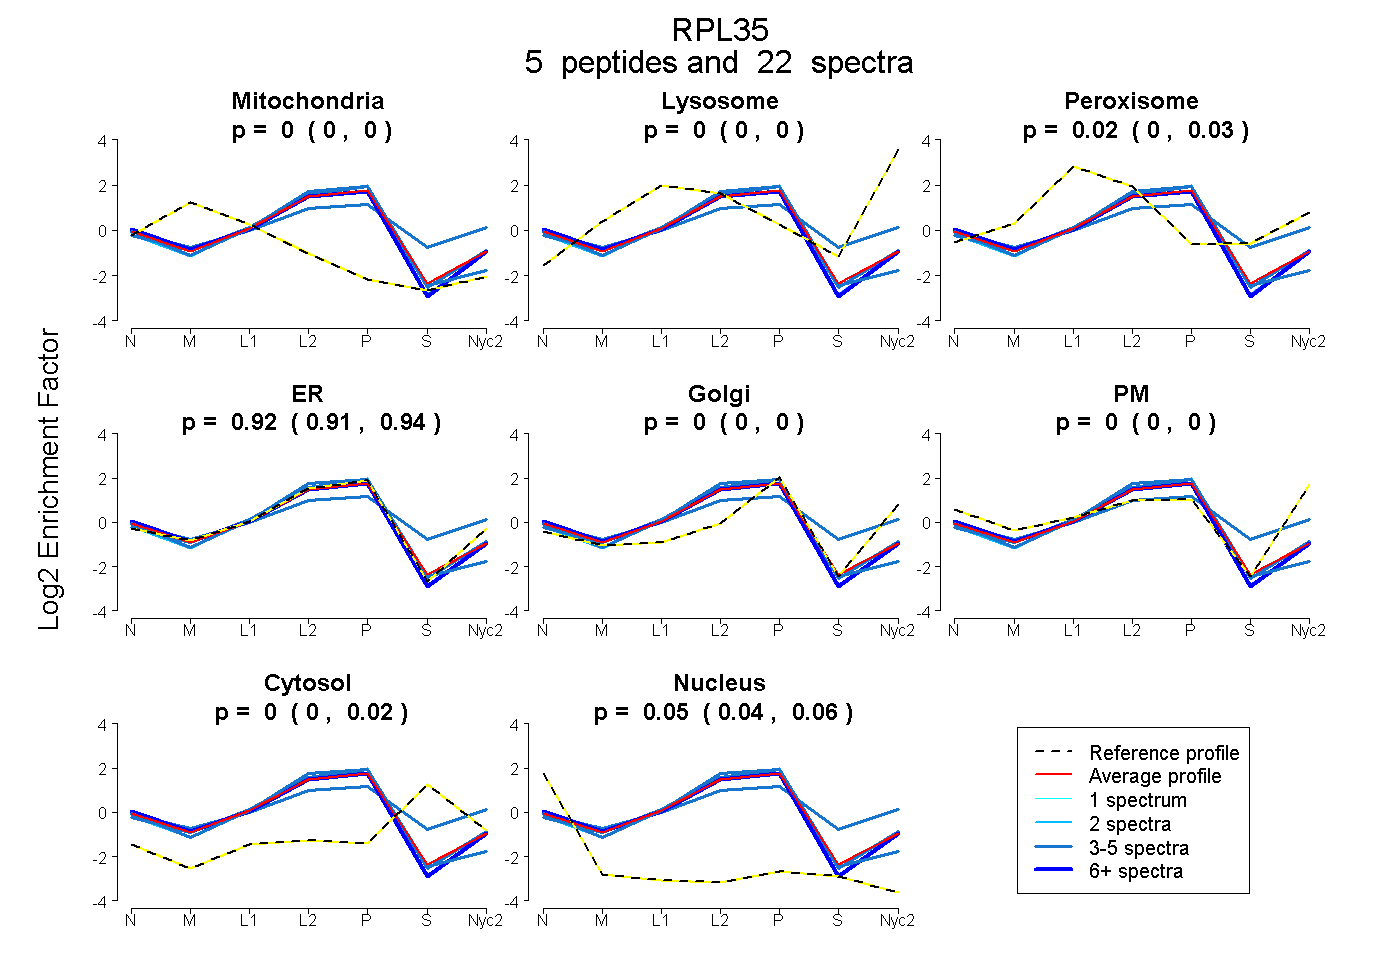
0.000 | 0.002
0.000 | 0.000
0.000 | 0.028
0.906 | 0.942
0.000 | 0.000
0.000 | 0.000
0.000 | 0.023
0.037 | 0.060
2peptides
spectra
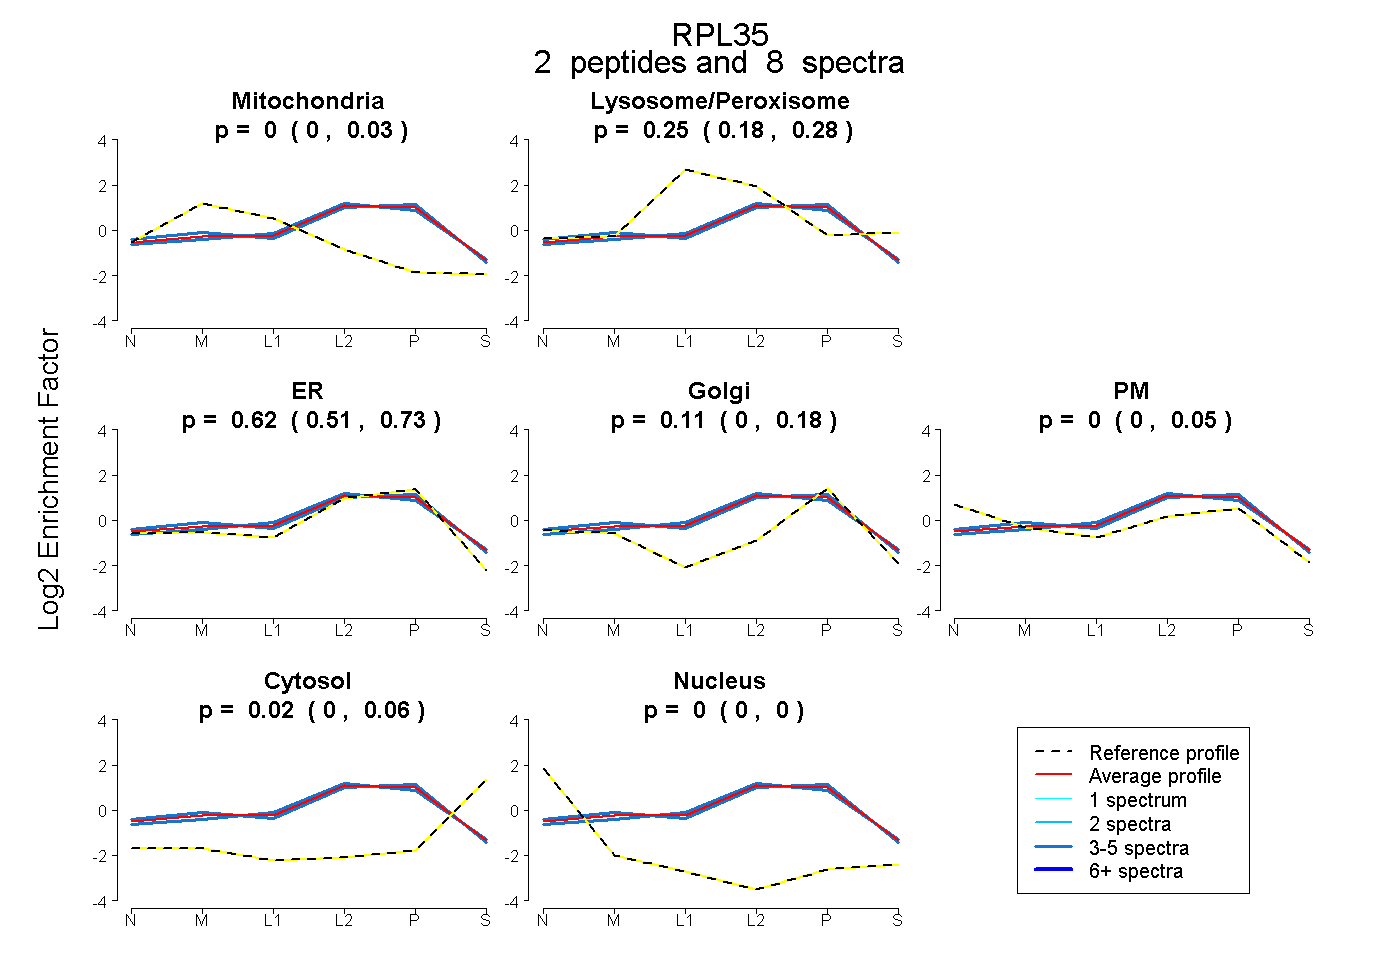
0.000 | 0.025
0.179 | 0.280
0.511 | 0.734
0.000 | 0.182
0.000 | 0.046
0.000 | 0.055
0.000 | 0.000
6peptides
spectra
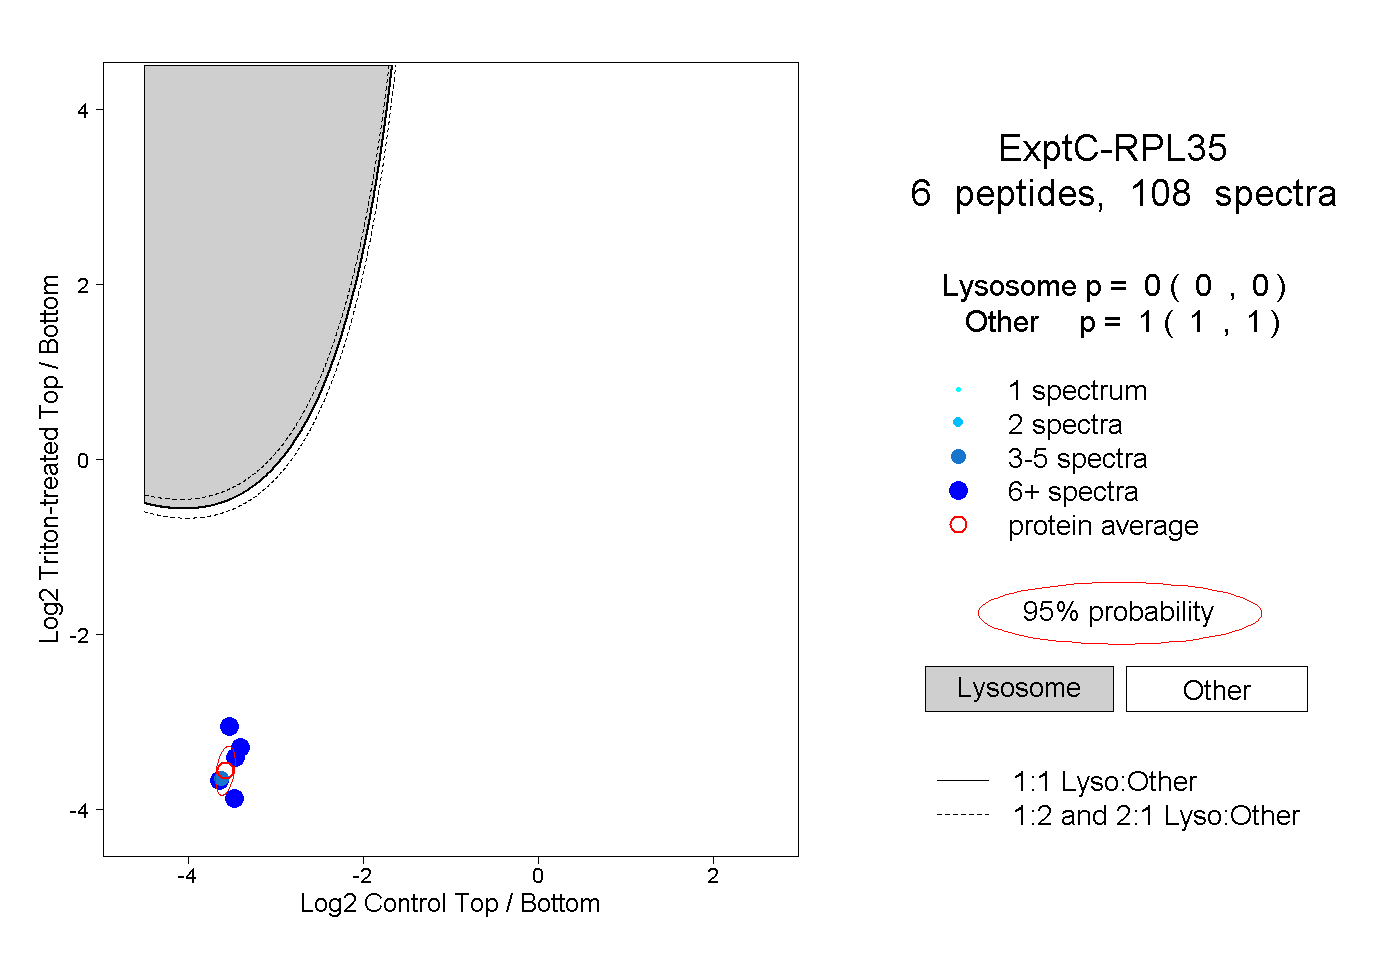
0.000 | 0.000
1.000 | 1.000
2peptides
spectra
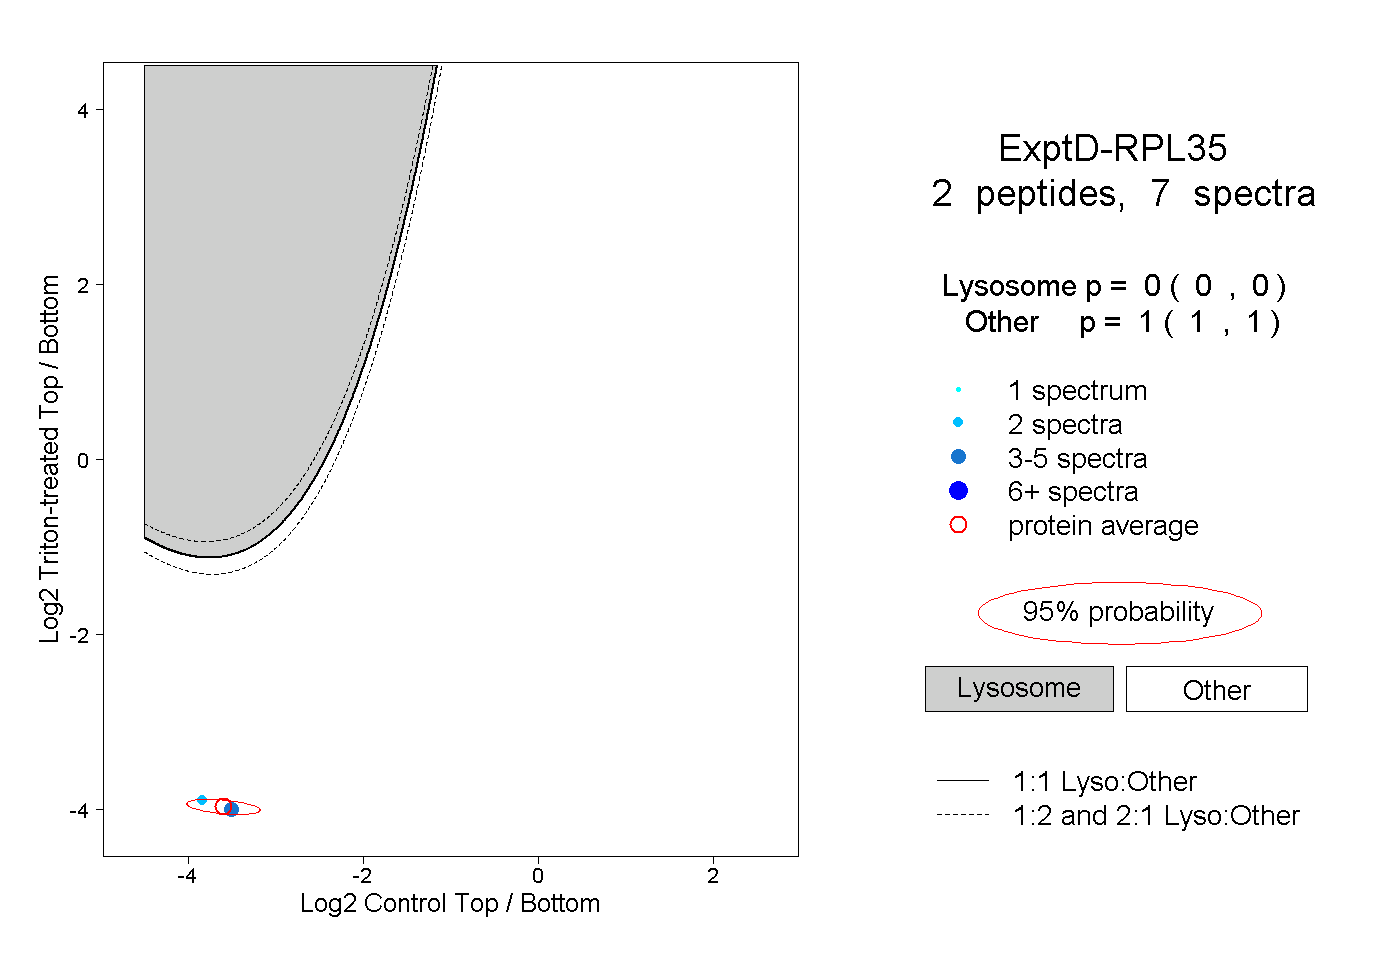
0.000 | 0.000
1.000 | 1.000