 5
5peptides
spectra
0.000 | 0.002
0.000 | 0.000
0.000 | 0.028
0.906 | 0.942
0.000 | 0.000
0.000 | 0.000
0.000 | 0.023
0.037 | 0.060
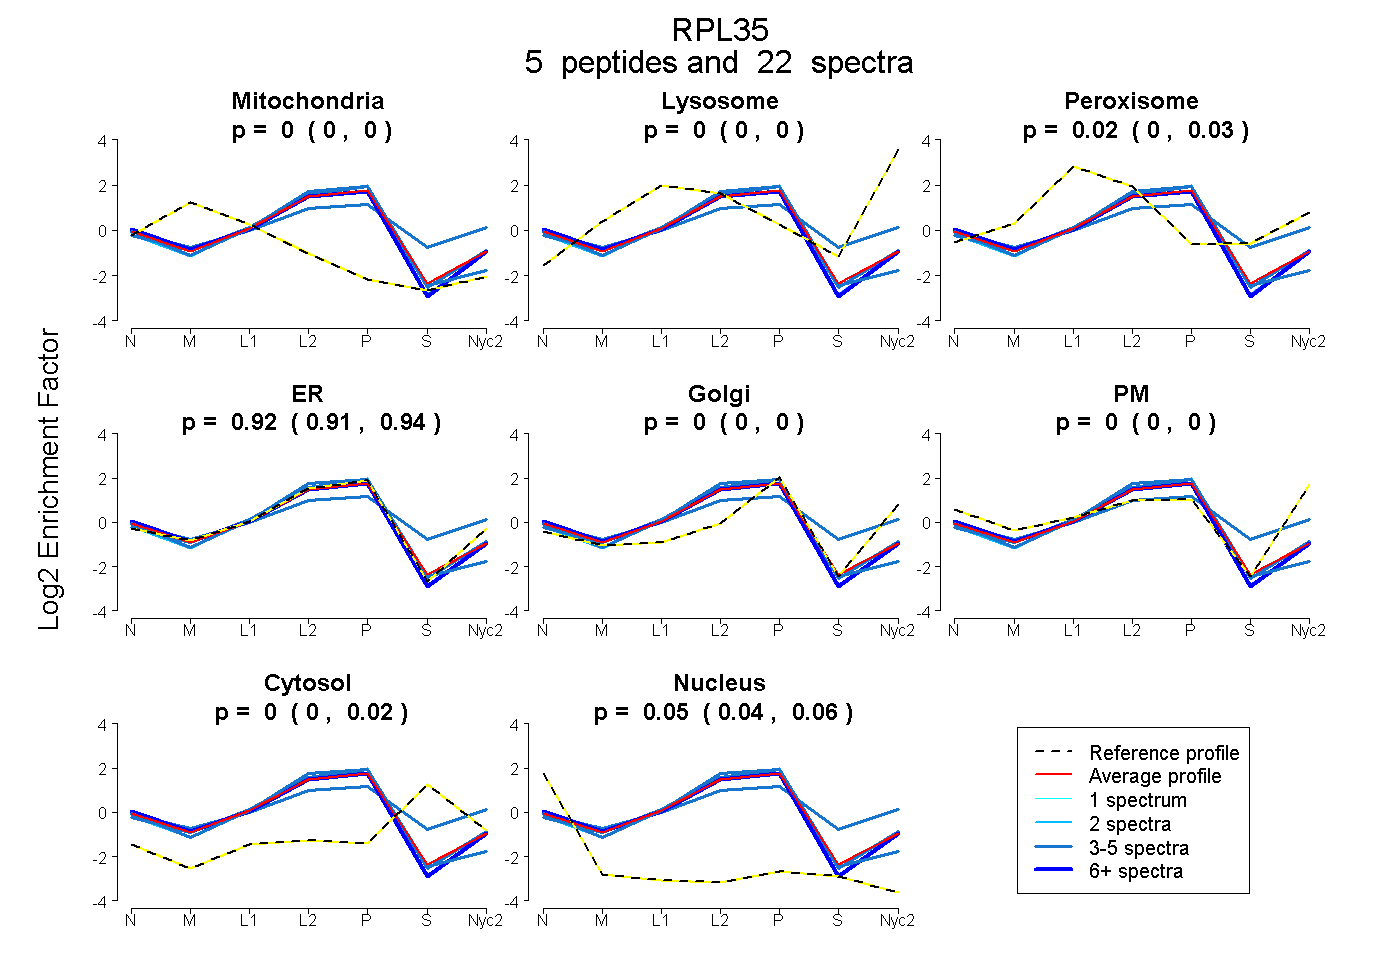
| Plot | Mito | Lyso | Perox | ER | Golgi | PM | Cytosol | Nucleus | |||||
| Expt A |
5 peptides |
22 spectra |
|
0.000 0.000 | 0.002 |
0.000 0.000 | 0.000 |
0.020 0.000 | 0.028 |
0.925 0.906 | 0.942 |
0.000 0.000 | 0.000 |
0.000 0.000 | 0.000 |
0.002 0.000 | 0.023 |
0.054 0.037 | 0.060 |
| 3 spectra, VLTVINQTQK | 0.000 | 0.000 | 0.149 | 0.430 | 0.036 | 0.164 | 0.221 | 0.000 | ||
| 2 spectra, LYPLR | 0.000 | 0.000 | 0.000 | 0.965 | 0.000 | 0.000 | 0.000 | 0.035 | ||
| 10 spectra, VTGGAASK | 0.006 | 0.000 | 0.000 | 0.939 | 0.000 | 0.000 | 0.000 | 0.055 | ||
| 4 spectra, YKPLDLRPK | 0.000 | 0.000 | 0.000 | 0.931 | 0.000 | 0.000 | 0.000 | 0.069 | ||
| 3 spectra, VELSQLR | 0.000 | 0.000 | 0.000 | 0.977 | 0.000 | 0.000 | 0.000 | 0.023 |
| Plot | Mito | Lyso or Perox | ER | Golgi | PM | Cytosol | Nucleus | ||||||
| Expt B |
2 peptides |
8 spectra |
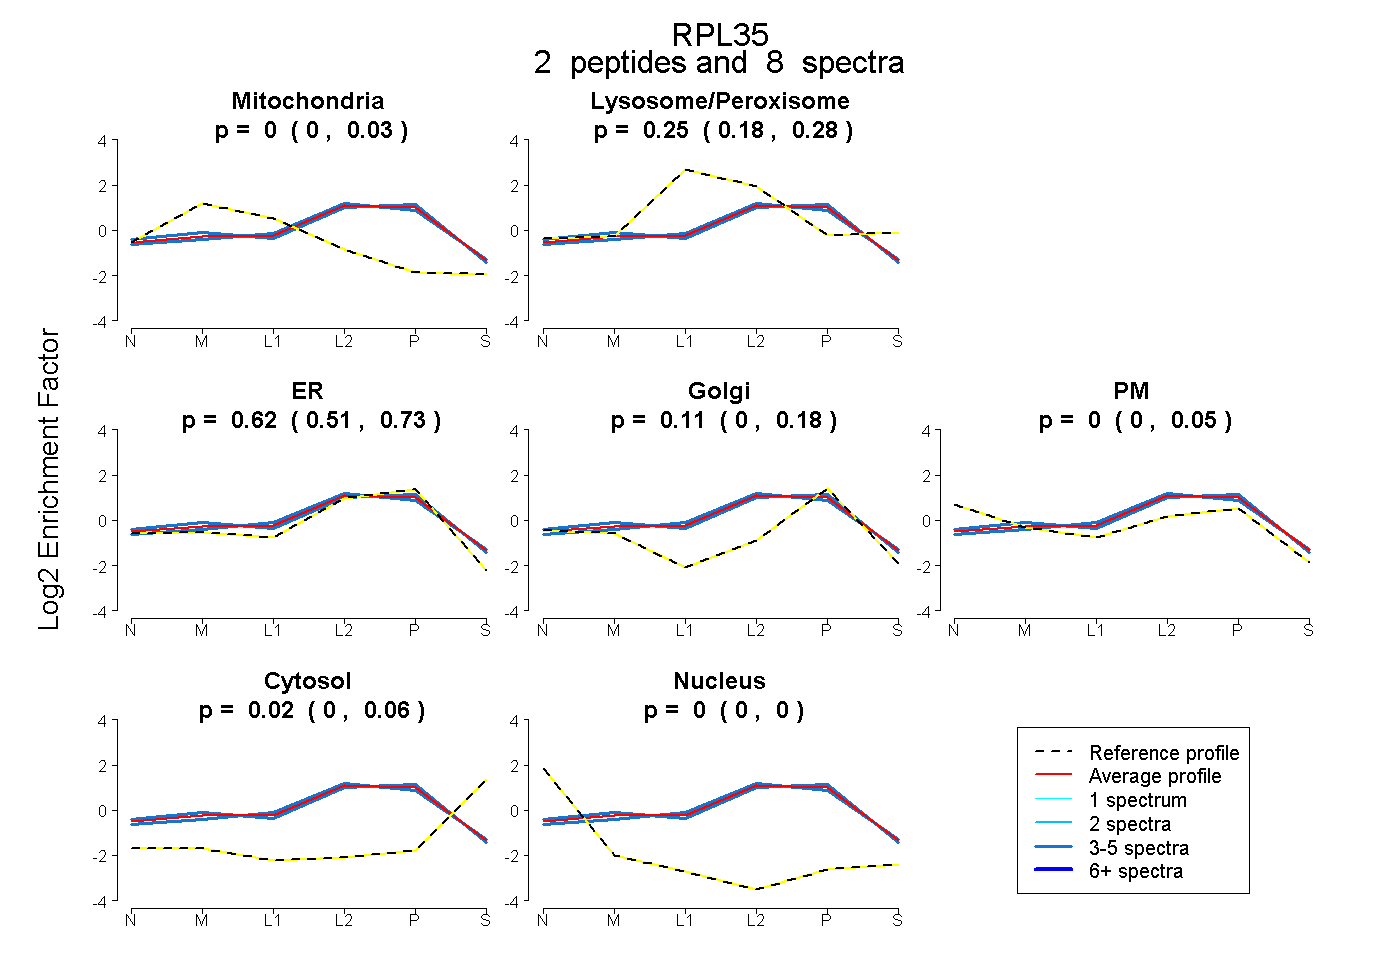 |
0.000 0.000 | 0.025 |
0.245 0.179 | 0.280 |
0.623 0.511 | 0.734 |
0.108 0.000 | 0.182 |
0.000 0.000 | 0.046 |
0.024 0.000 | 0.055 |
0.000 0.000 | 0.000 |
|||
| Plot | Lyso | Other | |||||||||||
| Expt C |
6 peptides |
108 spectra |
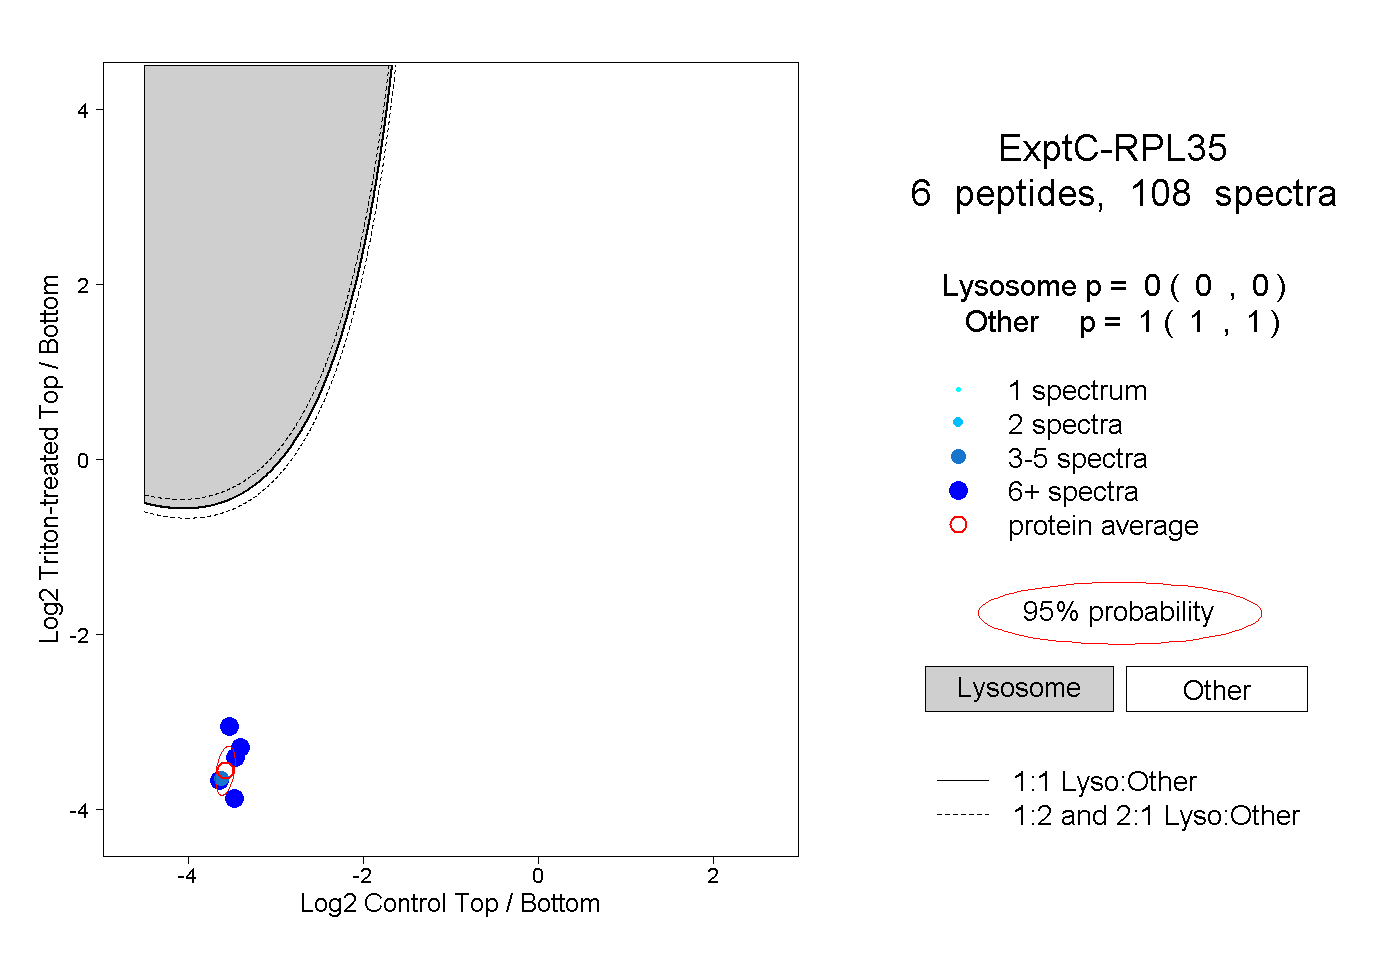 |
0.000 0.000 | 0.000 |
1.000 1.000 | 1.000 |
||||||||
| Plot | Lyso | Other | |||||||||||
| Expt D |
2 peptides |
7 spectra |
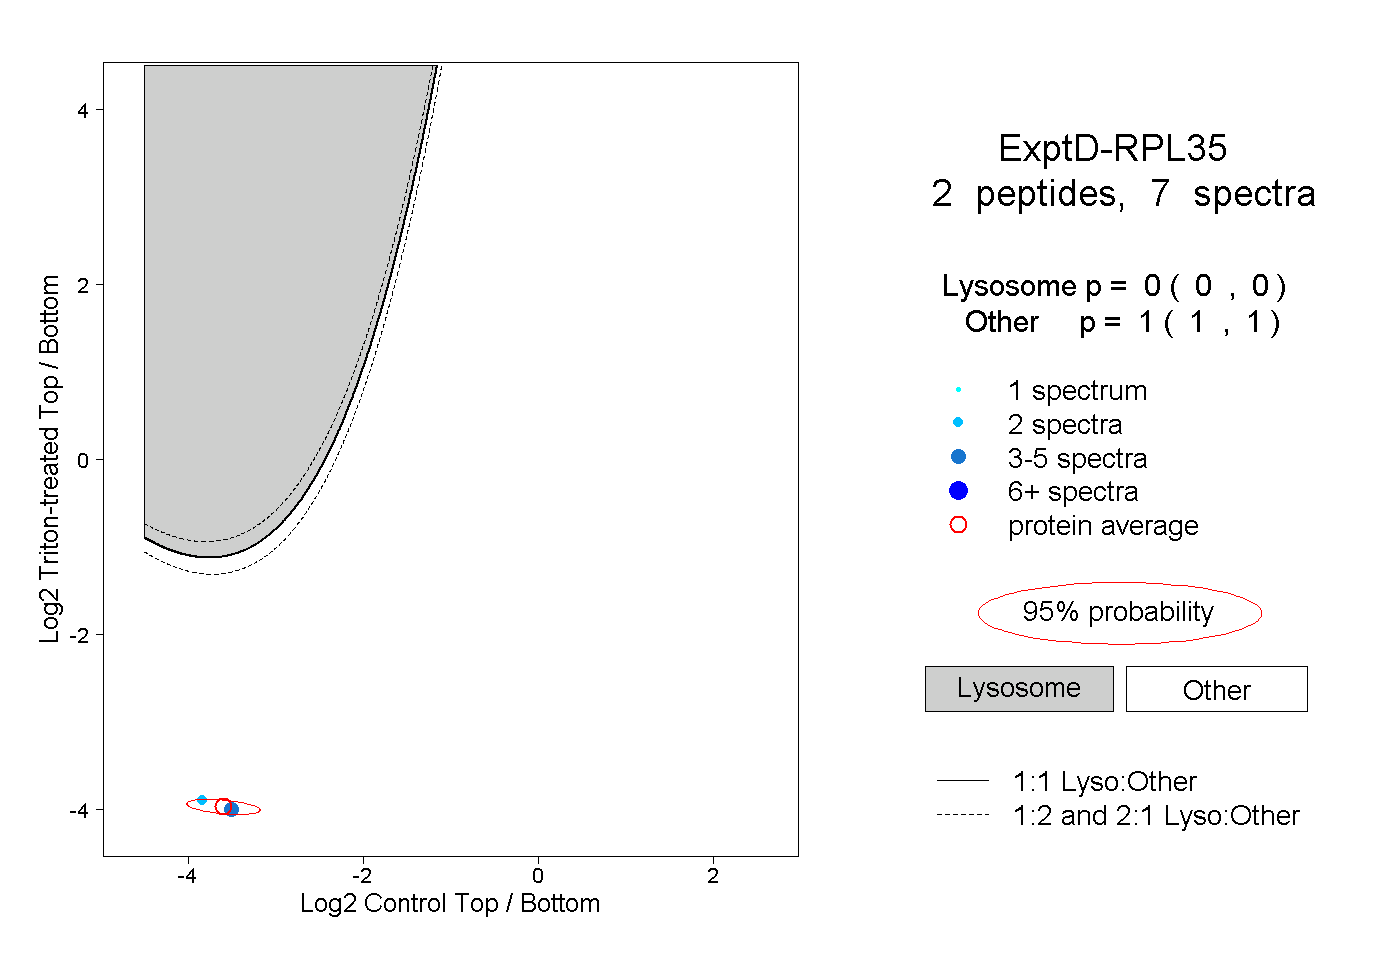 |
0.000 0.000 | 0.000 |
1.000 1.000 | 1.000 |