 2
2peptides
spectra

0.822 | 0.918
0.000 | 0.000
0.000 | 0.000
0.000 | 0.148
0.000 | 0.000
0.000 | 0.135
0.000 | 0.000
0.000 | 0.000
2peptides
spectra
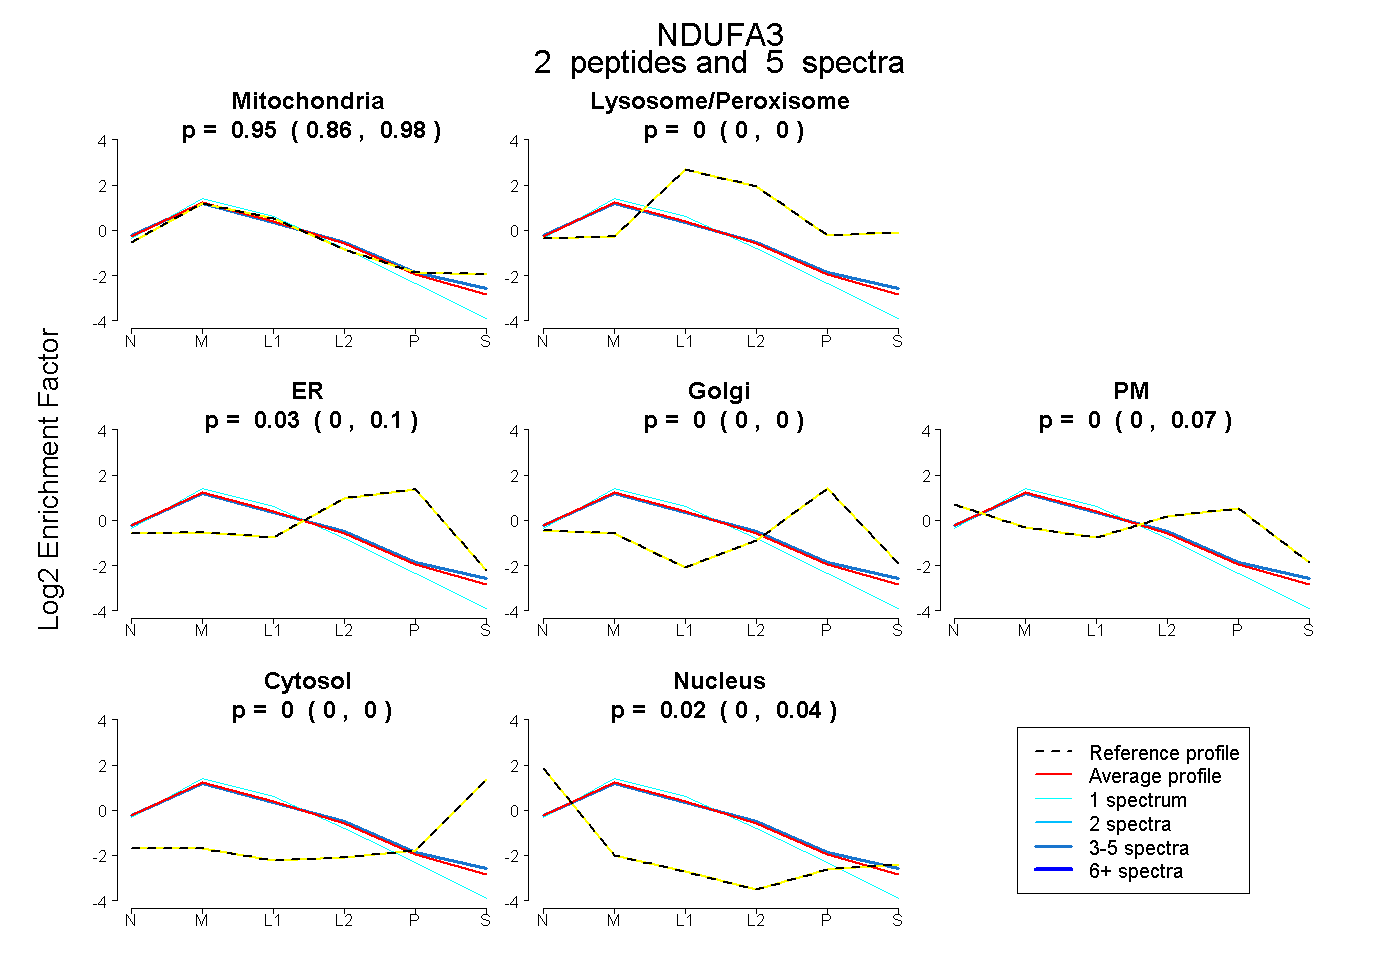
0.859 | 0.982
0.000 | 0.000
0.000 | 0.096
0.000 | 0.000
0.000 | 0.070
0.000 | 0.000
0.000 | 0.039
2peptides
spectra
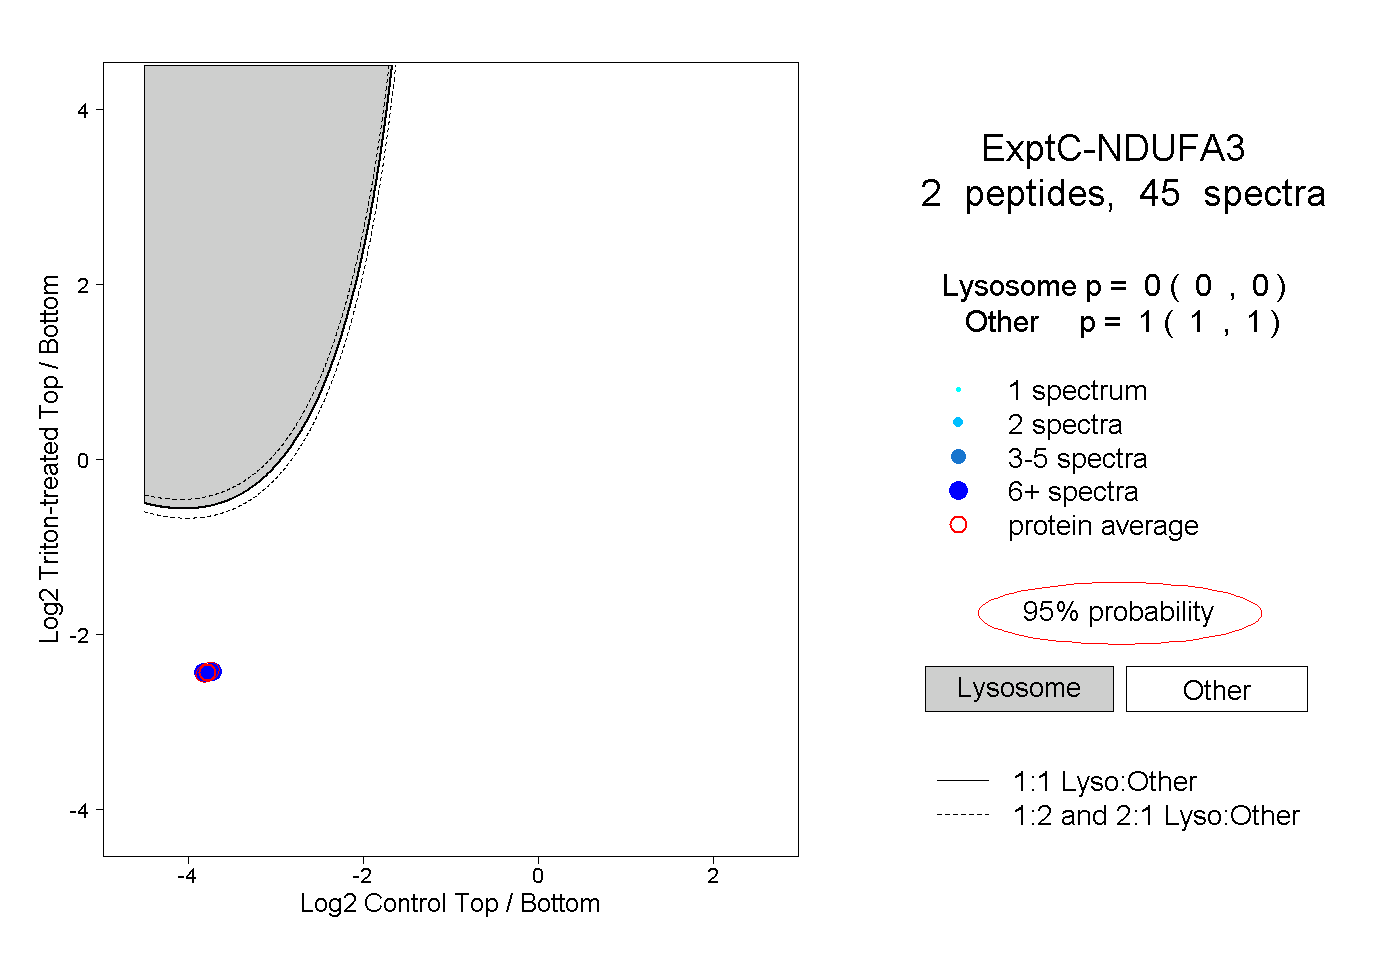
0.000 | 0.000
1.000 | 1.000
2peptides
spectra
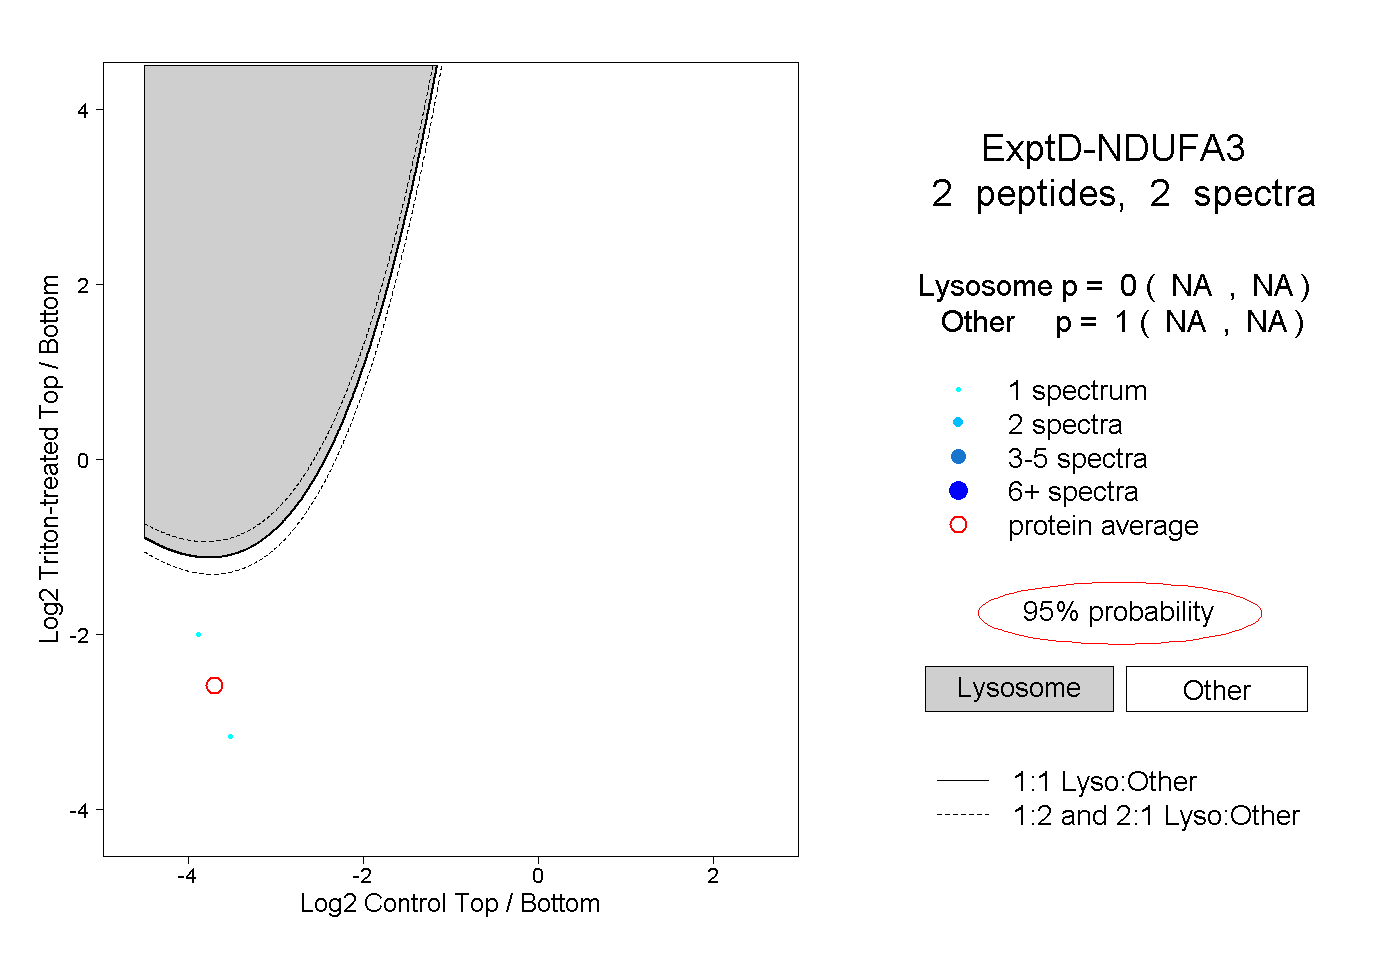
NA | NA
NA | NA