NDUFA3
[ENSRNOP00000019141]
Main page
| | | Plot |
Mito |
Lyso |
|
Perox |
ER |
Golgi |
PM |
Cytosol |
Nucleus |
|
| Expt A |
 2
2
peptides |
6
spectra |
 |
0.877
0.822 | 0.918 |
0.000
0.000 | 0.000 |
|
0.000
0.000 | 0.000 |
0.090
0.000 | 0.148 |
0.000
0.000 | 0.000 |
0.033
0.000 | 0.135 |
0.000
0.000 | 0.000 |
0.000
0.000 | 0.000 |
|
| | | Plot |
Mito |
|
Lyso or Perox |
|
ER |
Golgi |
PM |
Cytosol |
Nucleus |
|
| Expt B |
2
peptides |
5
spectra |
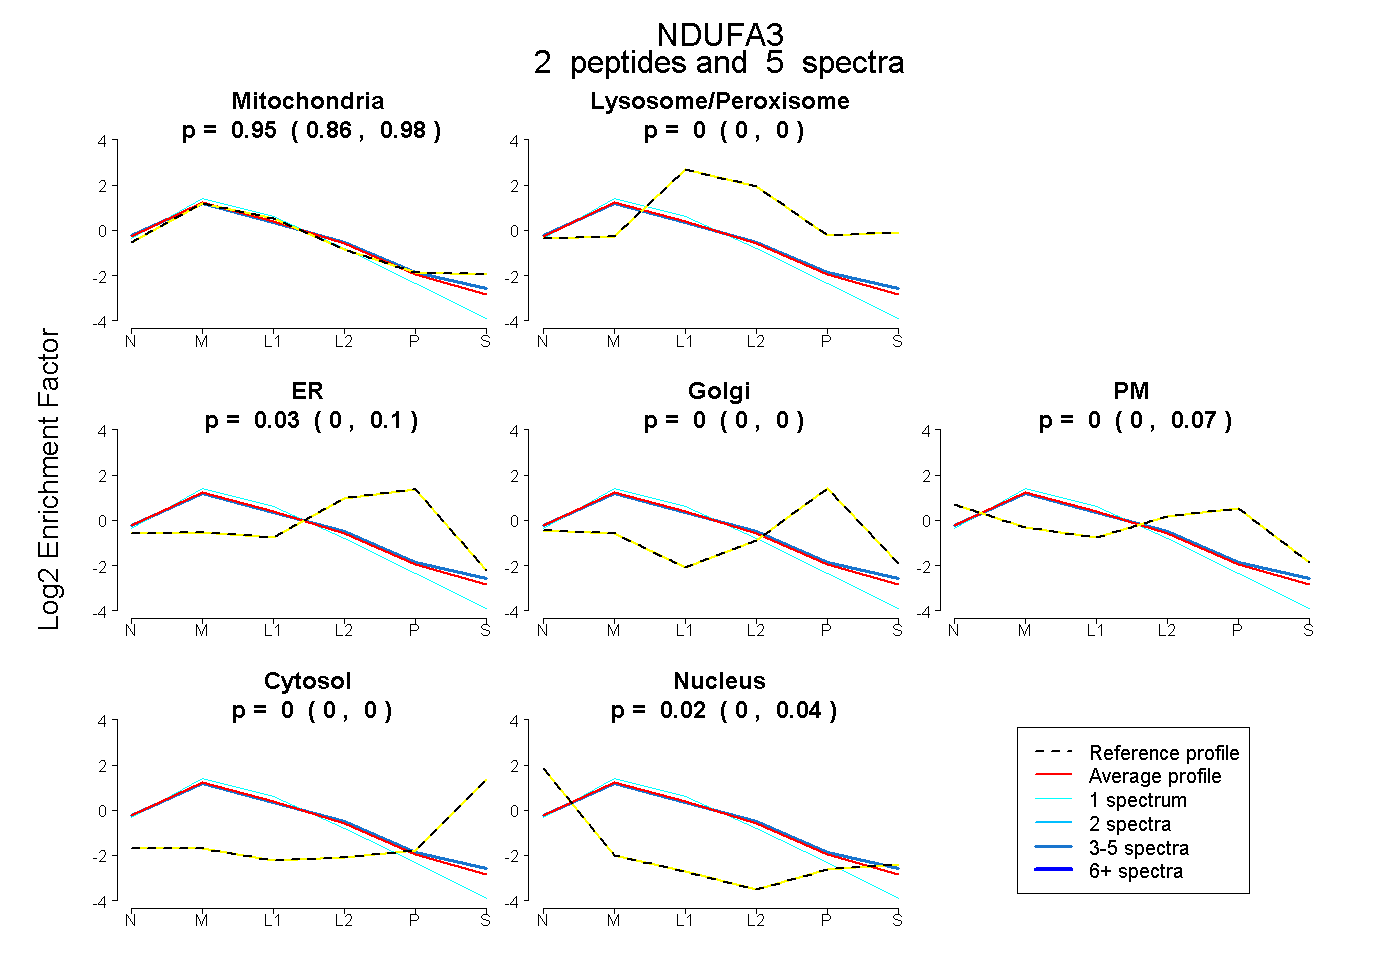 |
0.955
0.859 | 0.982 |
|
0.000
0.000 | 0.000 |
|
0.025
0.000 | 0.096 |
0.000
0.000 | 0.000 |
0.000
0.000 | 0.070 |
0.000
0.000 | 0.000 |
0.020
0.000 | 0.039 |
|
| 4 spectra, ATPYNYPVPVR |
0.922 |
|
0.000 |
|
0.001 |
0.000 |
0.069 |
0.000 |
0.007 |
|
| 1 spectrum, ISAFLK |
0.983 |
|
0.000 |
|
0.000 |
0.000 |
0.000 |
0.000 |
0.017 |
|
| | | Plot |
|
Lyso |
|
|
|
|
|
|
|
Other |
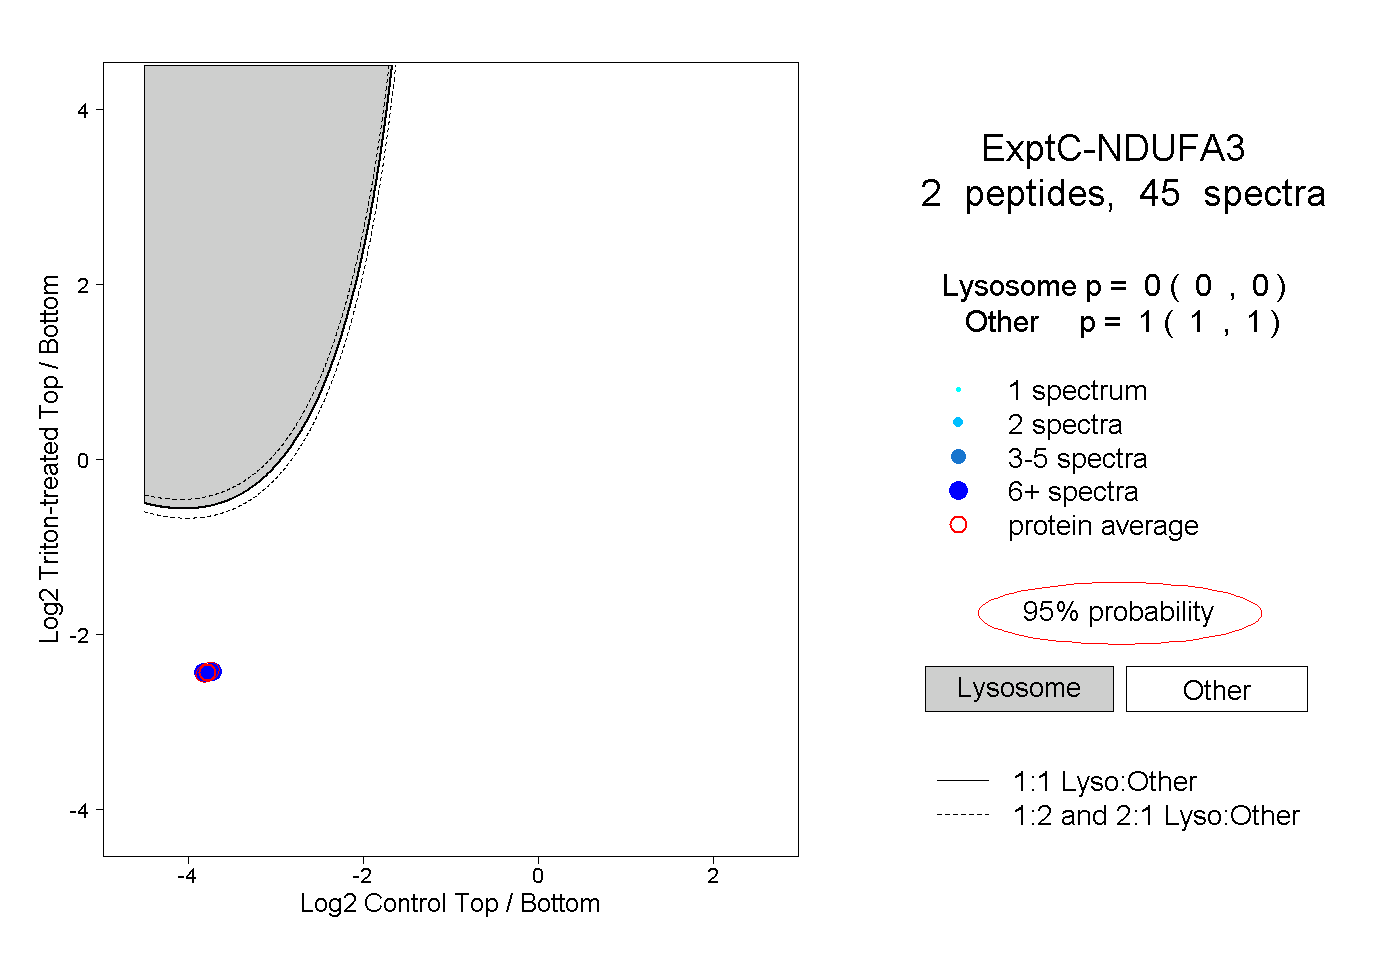
| Expt C |
2
peptides |
45
spectra |
 |
|
0.000
0.000 | 0.000 |
|
|
|
|
|
|
|
1.000
1.000 | 1.000 |
| | | Plot |
|
Lyso |
|
|
|
|
|
|
|
Other |
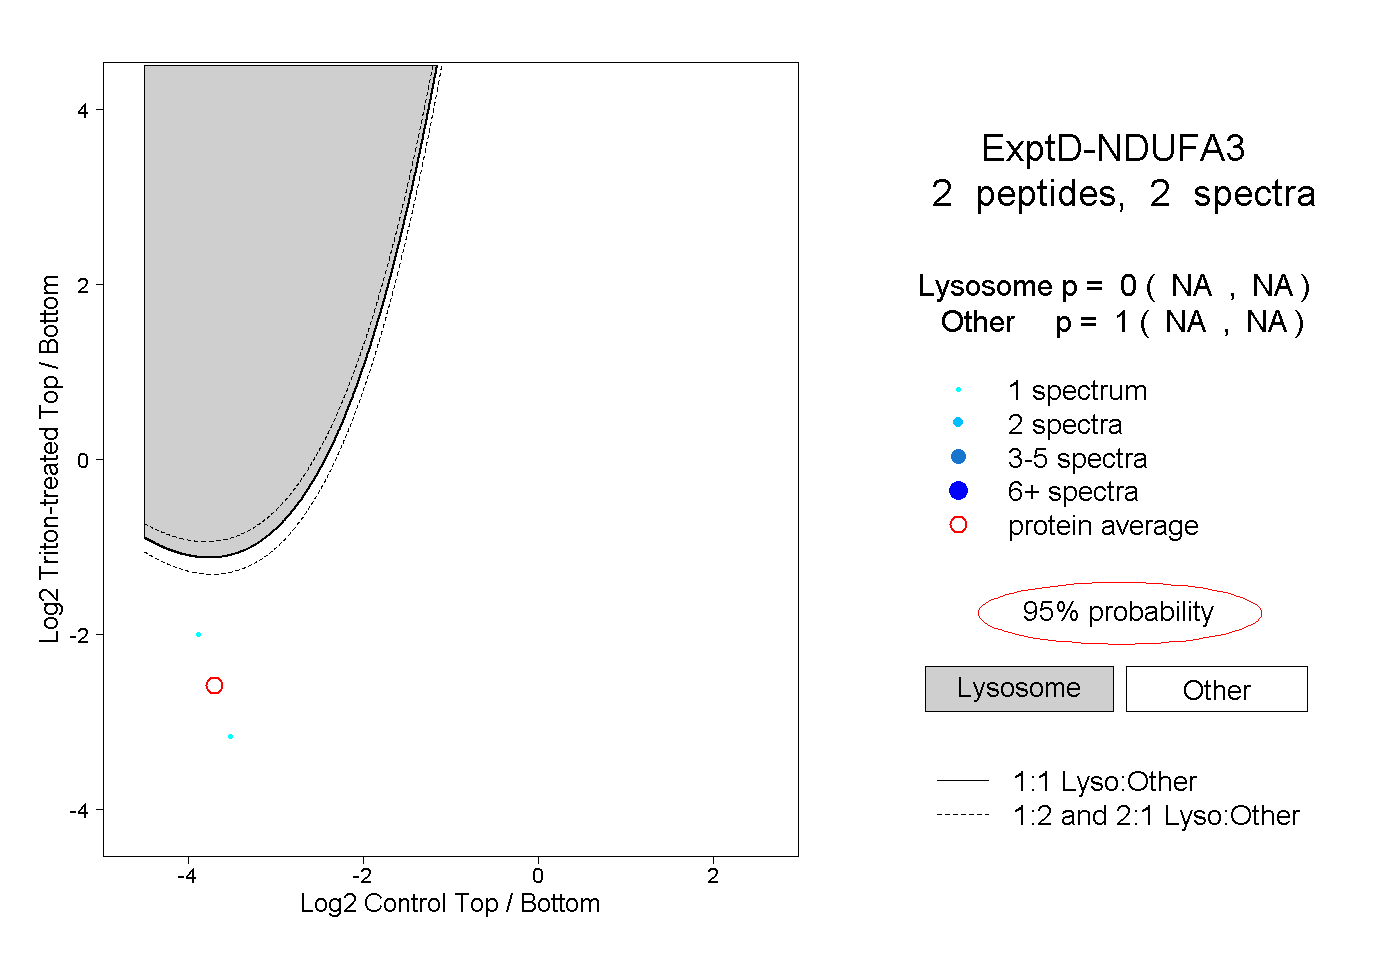
| Expt D |
2
peptides |
2
spectra |
 |
|
0.000
NA | NA |
|
|
|
|
|
|
|
1.000
NA | NA |