 4
4peptides
spectra
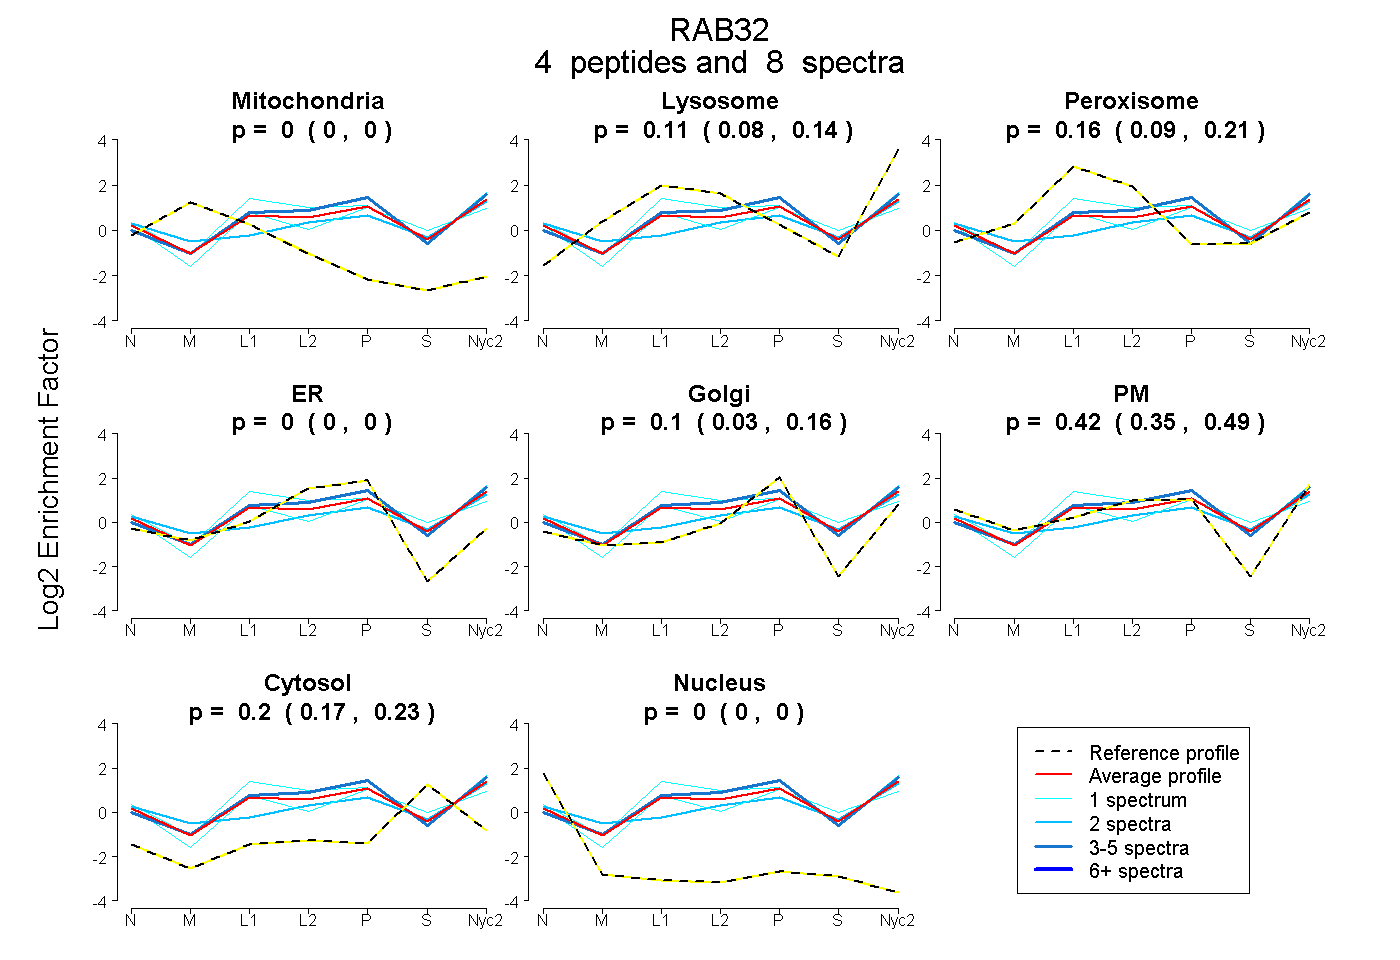
0.000 | 0.000
0.078 | 0.141
0.093 | 0.214
0.000 | 0.000
0.032 | 0.159
0.347 | 0.492
0.169 | 0.230
0.000 | 0.000
8peptides
spectra
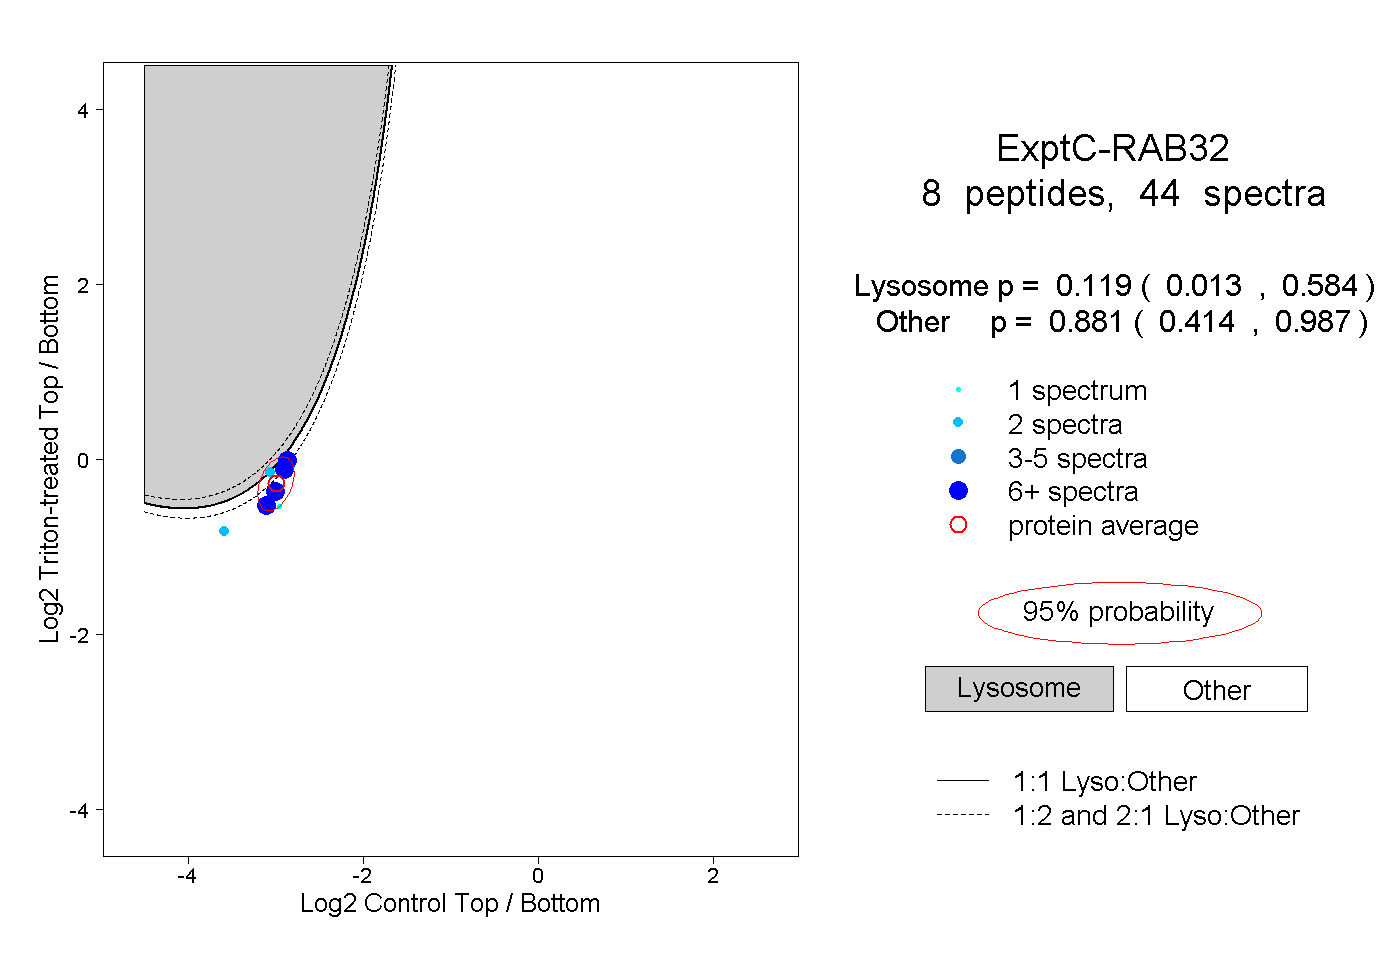
0.013 | 0.584
0.414 | 0.987
1peptide
spectra
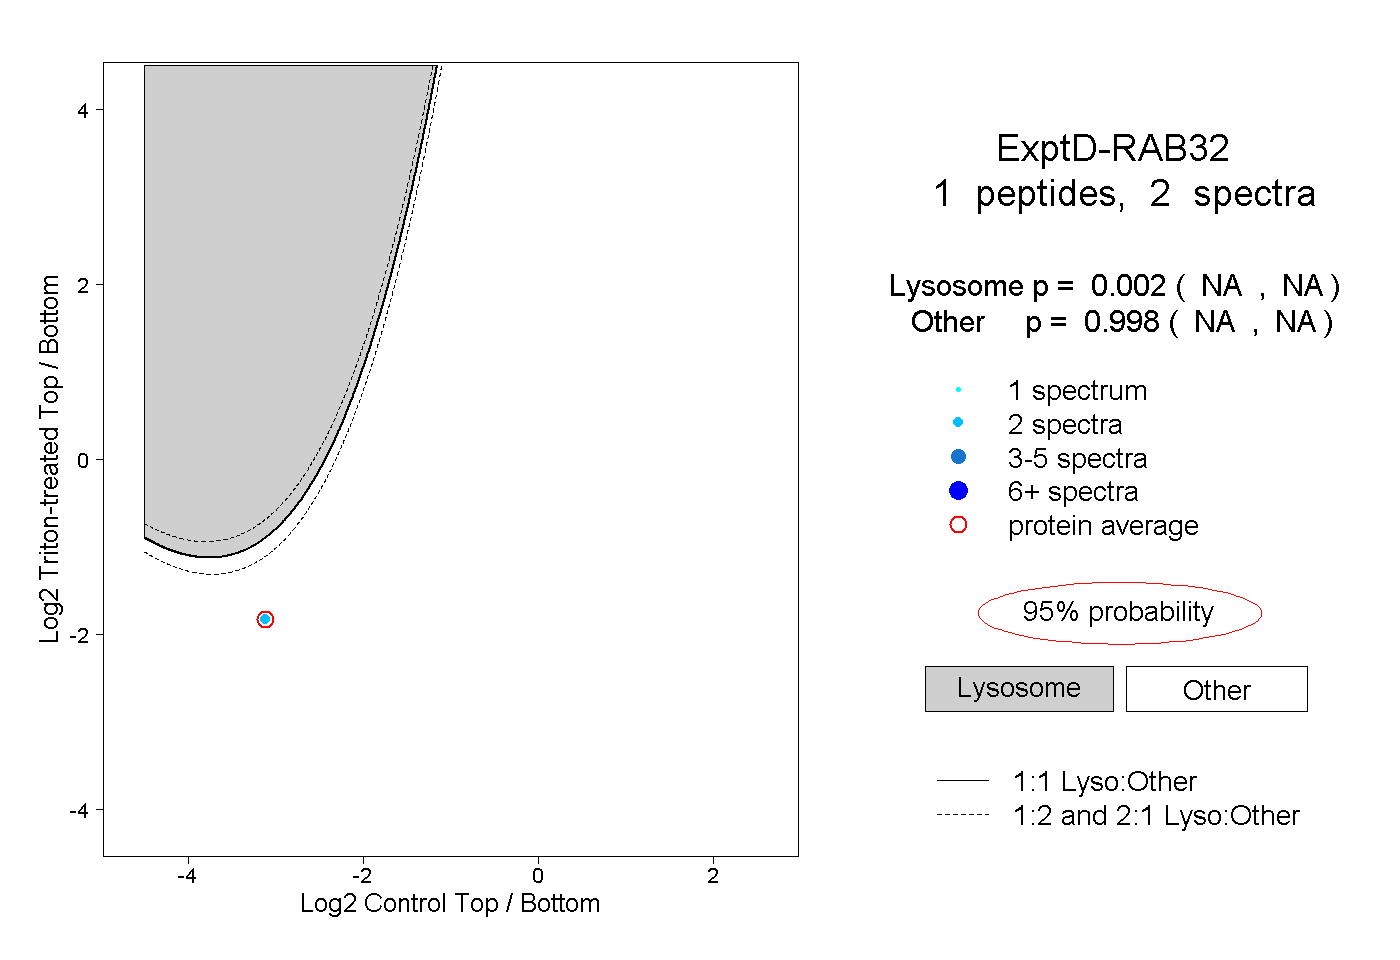
NA | NA
NA | NA