 4
4peptides
spectra
0.000 | 0.000
0.078 | 0.141
0.093 | 0.214
0.000 | 0.000
0.032 | 0.159
0.347 | 0.492
0.169 | 0.230
0.000 | 0.000
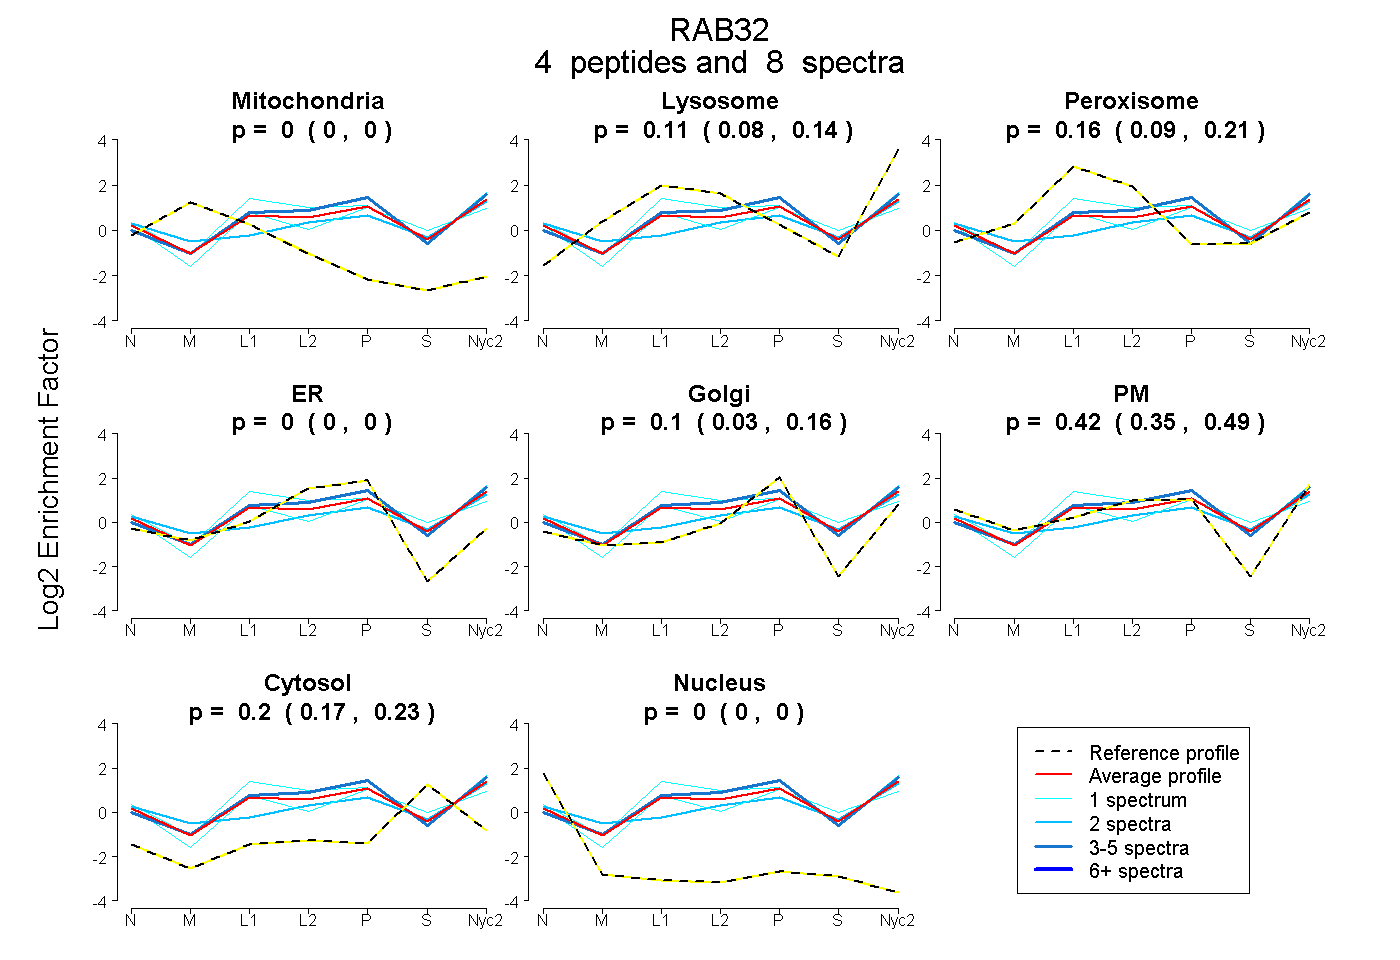
| Plot | Mito | Lyso | Perox | ER | Golgi | PM | Cytosol | Nucleus | |||||
| Expt A |
4 peptides |
8 spectra |
|
0.000 0.000 | 0.000 |
0.112 0.078 | 0.141 |
0.159 0.093 | 0.214 |
0.000 0.000 | 0.000 |
0.103 0.032 | 0.159 |
0.425 0.347 | 0.492 |
0.202 0.169 | 0.230 |
0.000 0.000 | 0.000 |
| 4 spectra, LQLWDIAGQER | 0.000 | 0.192 | 0.184 | 0.000 | 0.298 | 0.221 | 0.105 | 0.000 | ||
| 1 spectrum, DNINIDEATR | 0.000 | 0.119 | 0.277 | 0.000 | 0.033 | 0.463 | 0.107 | 0.000 | ||
| 2 spectra, DSSQSPSQMNQFCK | 0.000 | 0.102 | 0.011 | 0.000 | 0.000 | 0.588 | 0.299 | 0.000 | ||
| 1 spectrum, LGQQGETATAVPETR | 0.000 | 0.014 | 0.234 | 0.000 | 0.180 | 0.283 | 0.290 | 0.000 |
| Plot | Lyso | Other | |||||||||||
| Expt C |
8 peptides |
44 spectra |
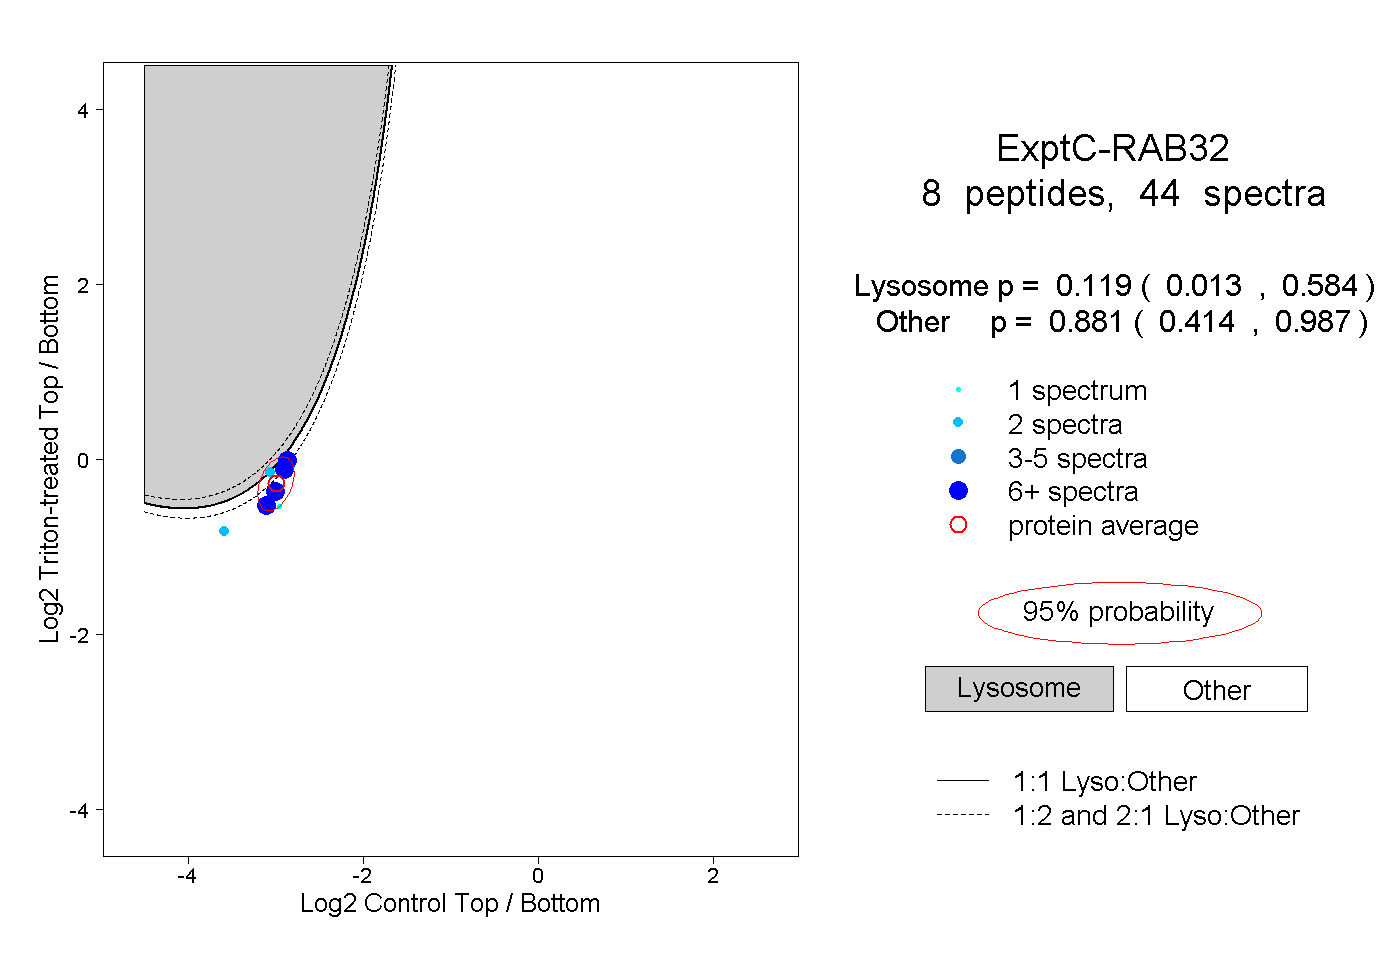 |
0.119 0.013 | 0.584 |
0.881 0.414 | 0.987 |
||||||||
| Plot | Lyso | Other | |||||||||||
| Expt D |
1 peptide |
2 spectra |
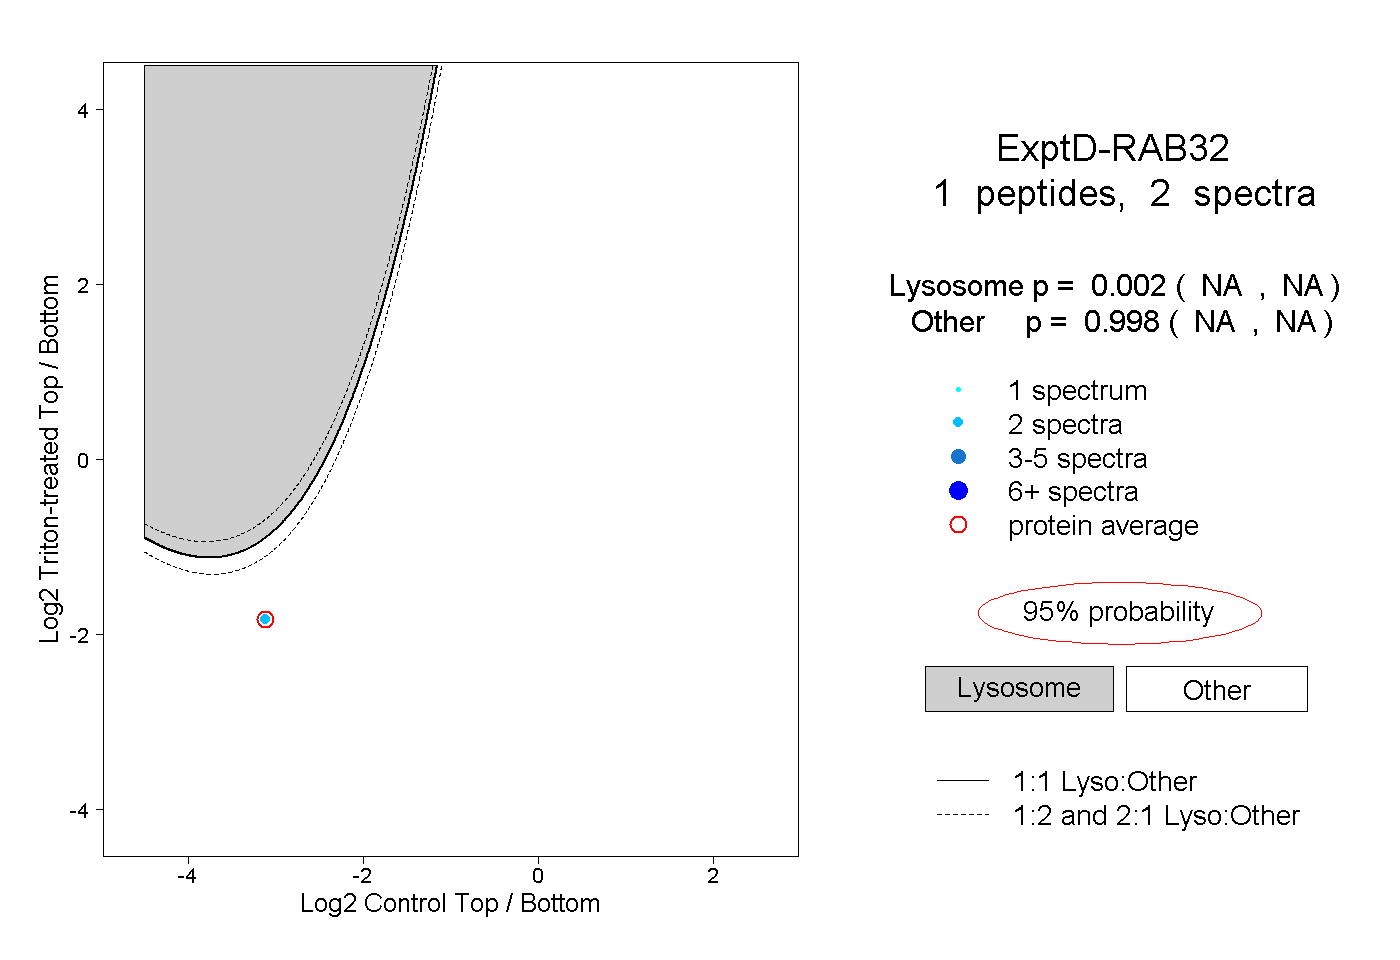 |
0.002 NA | NA |
0.998 NA | NA |