 13
13peptides
spectra
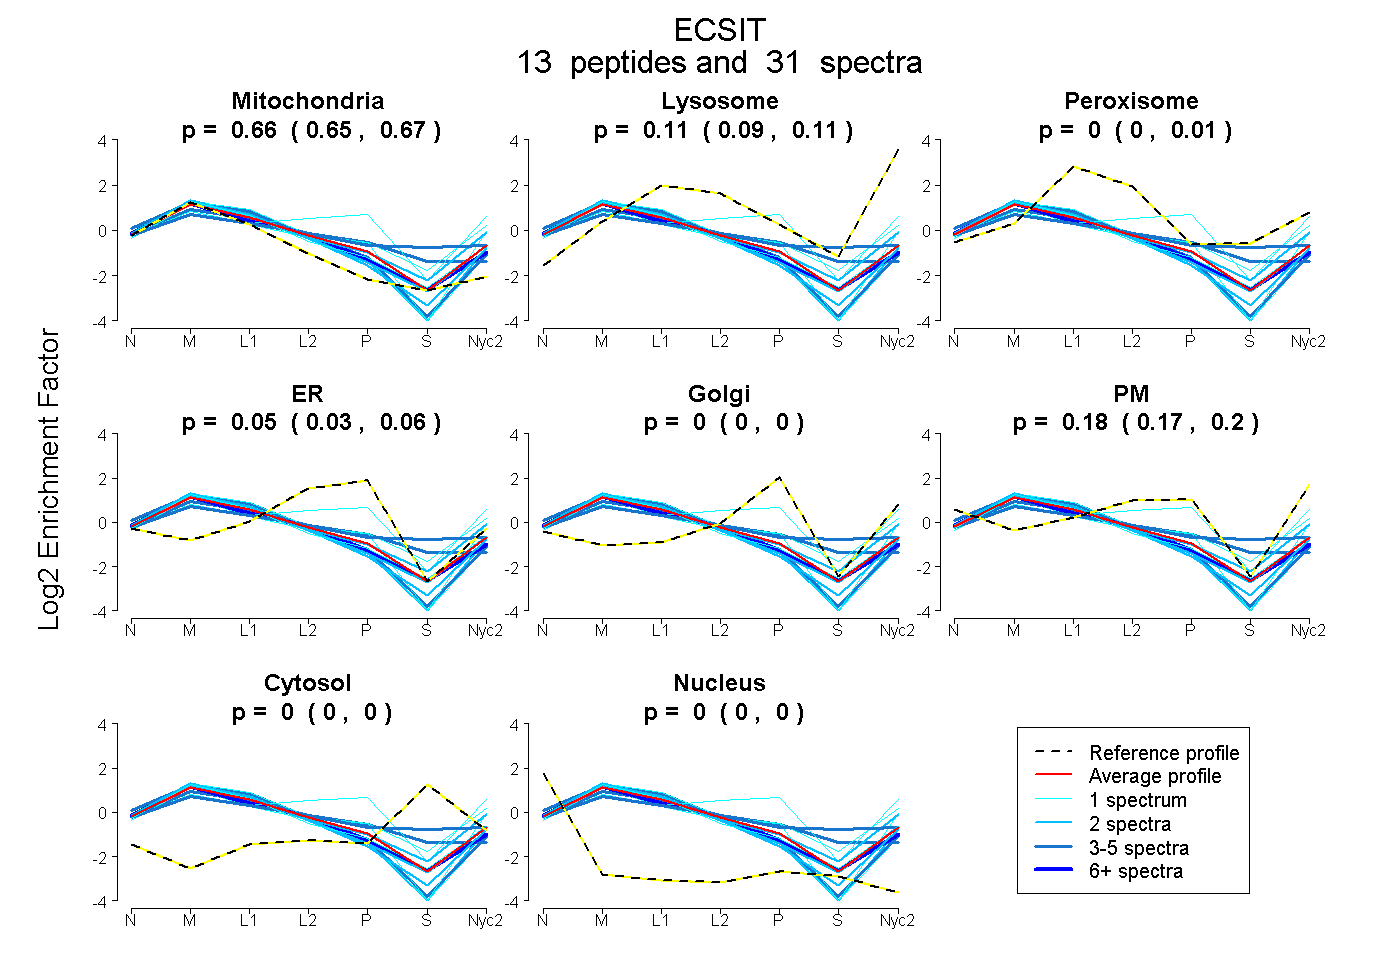
0.653 | 0.667
0.095 | 0.113
0.000 | 0.007
0.031 | 0.063
0.000 | 0.000
0.167 | 0.199
0.000 | 0.000
0.000 | 0.000
3peptides
spectra
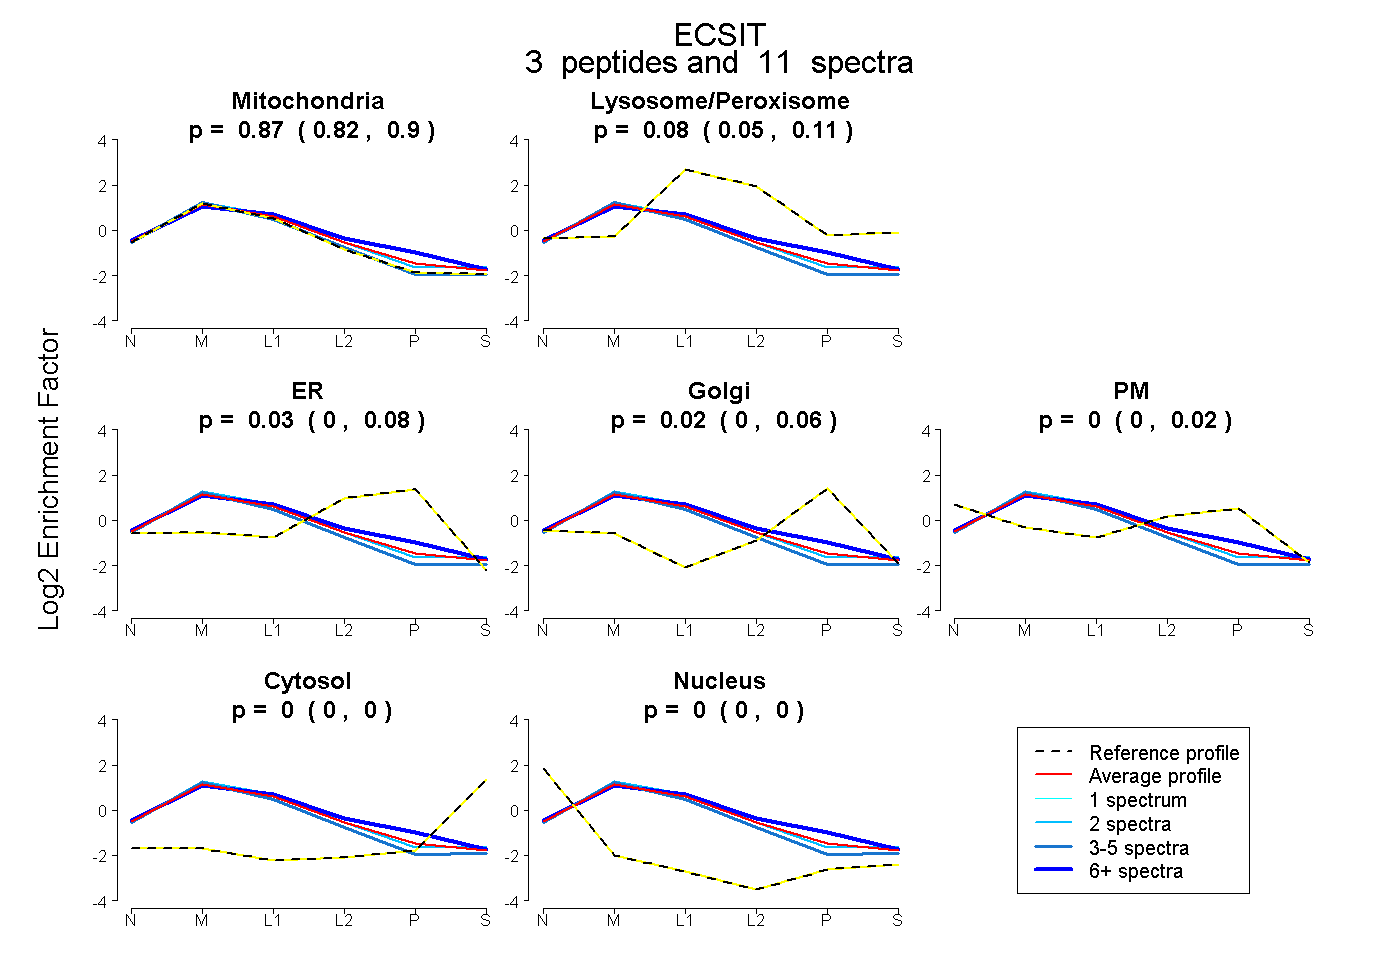
0.821 | 0.898
0.051 | 0.107
0.000 | 0.075
0.000 | 0.056
0.000 | 0.018
0.000 | 0.002
0.000 | 0.000
13peptides
spectra
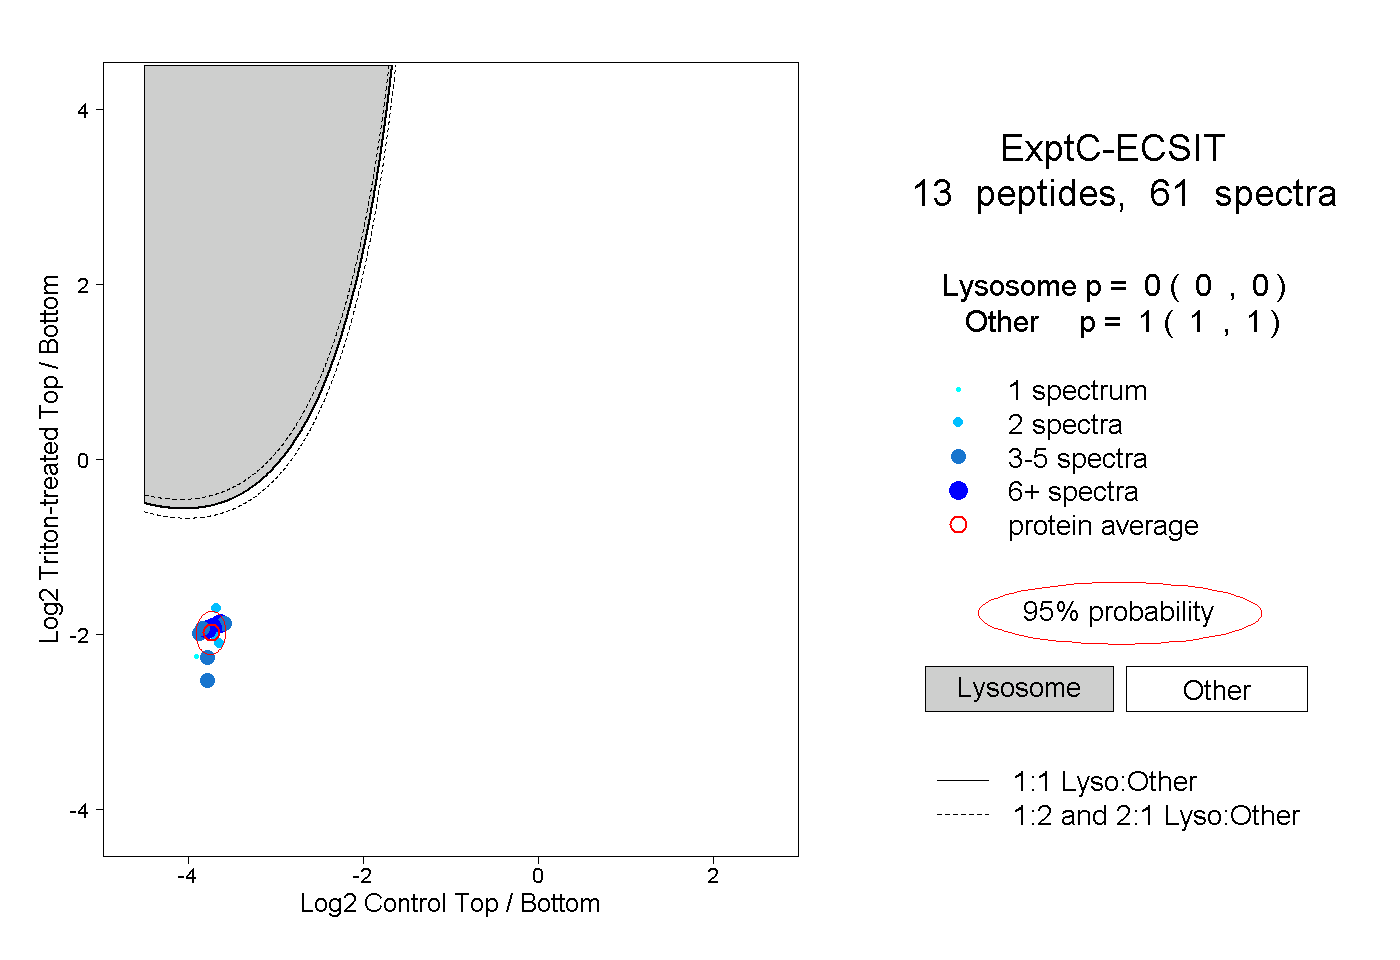
0.000 | 0.000
1.000 | 1.000
3peptides
spectra
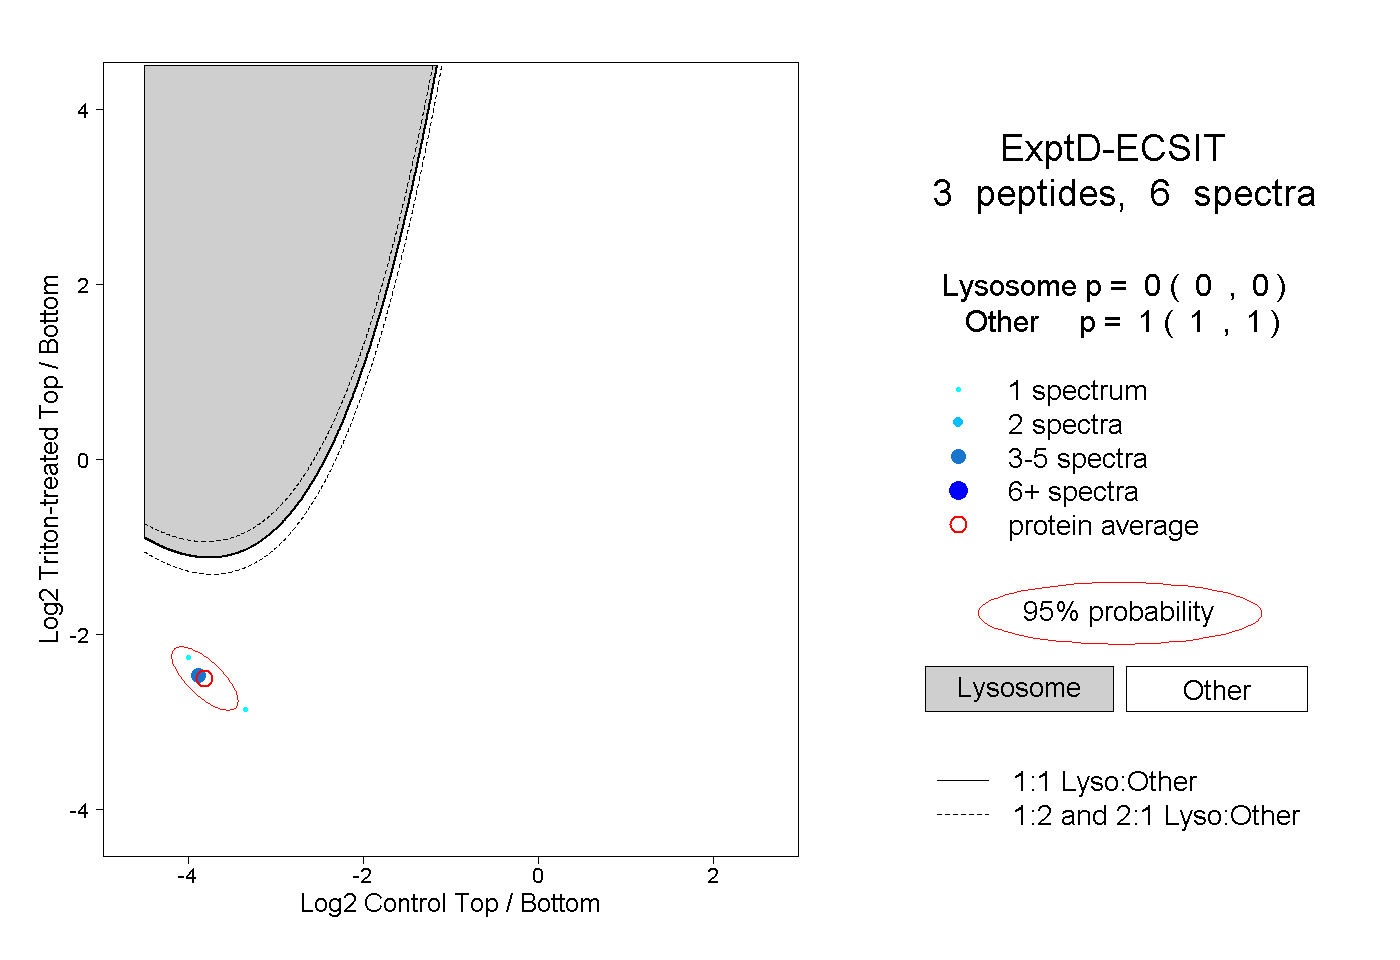
0.000 | 0.000
1.000 | 1.000