 13
13peptides
spectra
0.653 | 0.667
0.095 | 0.113
0.000 | 0.007
0.031 | 0.063
0.000 | 0.000
0.167 | 0.199
0.000 | 0.000
0.000 | 0.000
| Plot | Mito | Lyso | Perox | ER | Golgi | PM | Cytosol | Nucleus | |||||
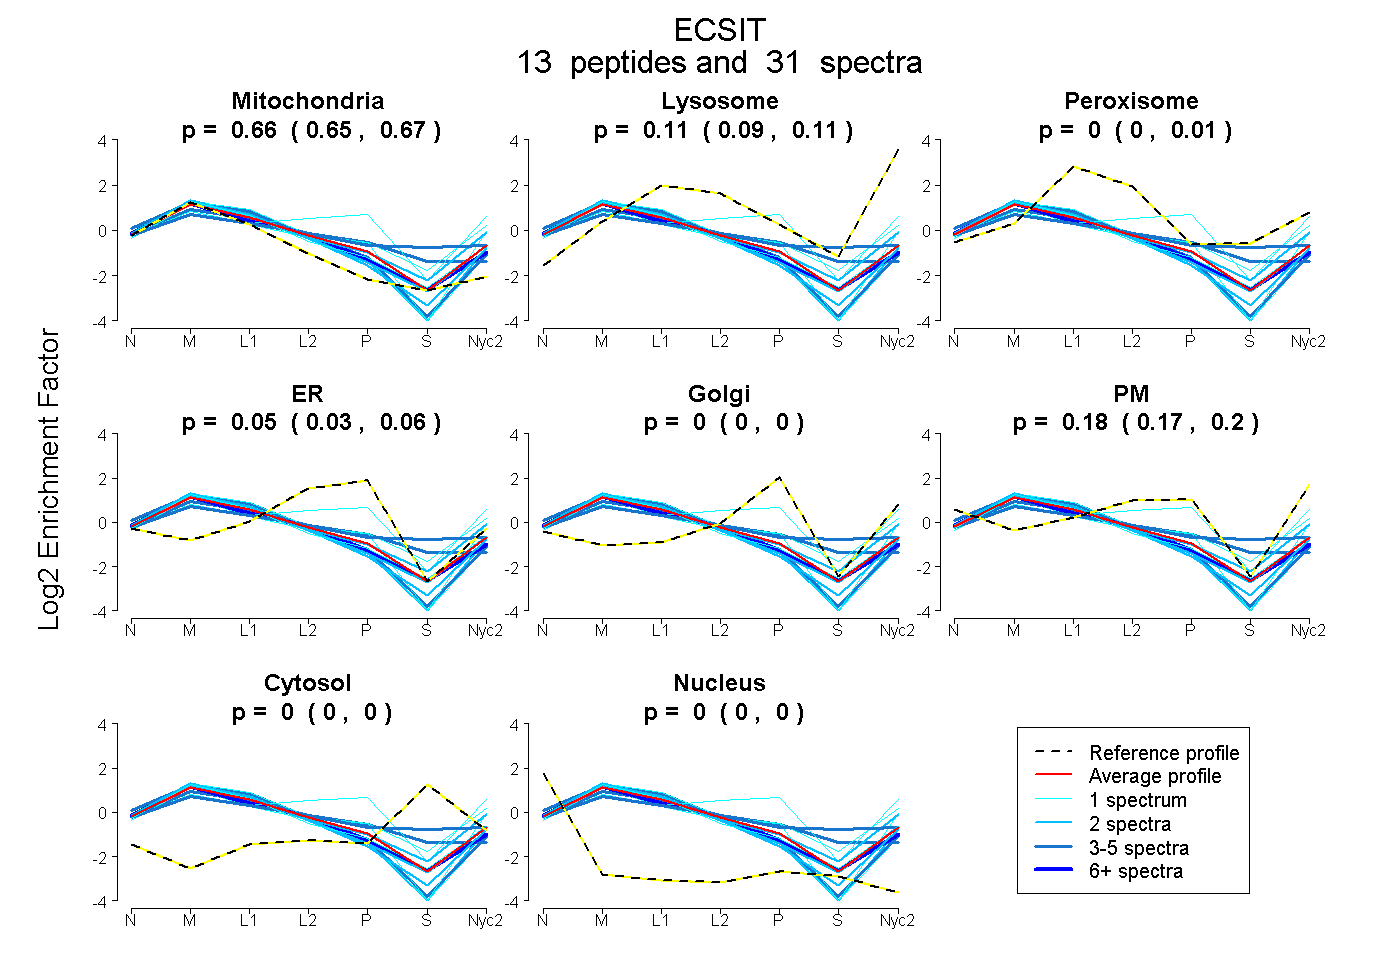
| Expt A |
13 peptides |
31 spectra |
|
0.661 0.653 | 0.667 |
0.106 0.095 | 0.113 |
0.000 0.000 | 0.007 |
0.049 0.031 | 0.063 |
0.000 0.000 | 0.000 |
0.183 0.167 | 0.199 |
0.000 0.000 | 0.000 |
0.000 0.000 | 0.000 |
| 1 spectrum, SYPMLK | 0.721 | 0.154 | 0.000 | 0.000 | 0.000 | 0.126 | 0.000 | 0.000 | ||
| 2 spectra, NINPYPVPR | 0.760 | 0.079 | 0.000 | 0.000 | 0.000 | 0.161 | 0.000 | 0.000 | ||
| 4 spectra, QQECGVAVLEQMER | 0.404 | 0.000 | 0.288 | 0.000 | 0.133 | 0.006 | 0.169 | 0.000 | ||
| 2 spectra, MPEFGVER | 0.623 | 0.229 | 0.000 | 0.000 | 0.000 | 0.148 | 0.000 | 0.000 | ||
| 1 spectrum, LEGQSPPHSPPK | 0.269 | 0.192 | 0.000 | 0.170 | 0.108 | 0.260 | 0.000 | 0.000 | ||
| 2 spectra, STGELLATTR | 0.732 | 0.151 | 0.000 | 0.000 | 0.000 | 0.117 | 0.000 | 0.000 | ||
| 5 spectra, CVYYHILR | 0.540 | 0.000 | 0.191 | 0.184 | 0.004 | 0.000 | 0.081 | 0.000 | ||
| 6 spectra, IFVHYPR | 0.723 | 0.067 | 0.016 | 0.042 | 0.000 | 0.152 | 0.000 | 0.000 | ||
| 2 spectra, ASFLNAVR | 0.729 | 0.015 | 0.000 | 0.000 | 0.000 | 0.257 | 0.000 | 0.000 | ||
| 1 spectrum, HNPSRPVFVEGPFPLWLR | 0.563 | 0.067 | 0.000 | 0.000 | 0.000 | 0.370 | 0.000 | 0.000 | ||
| 1 spectrum, EVFRPR | 0.528 | 0.260 | 0.000 | 0.000 | 0.162 | 0.046 | 0.004 | 0.000 | ||
| 3 spectra, GHVDFIYLALR | 0.734 | 0.000 | 0.000 | 0.031 | 0.000 | 0.235 | 0.000 | 0.000 | ||
| 1 spectrum, DLPQDPLDLAK | 0.747 | 0.000 | 0.000 | 0.063 | 0.000 | 0.191 | 0.000 | 0.000 |
| Plot | Mito | Lyso or Perox | ER | Golgi | PM | Cytosol | Nucleus | ||||||
| Expt B |
3 peptides |
11 spectra |
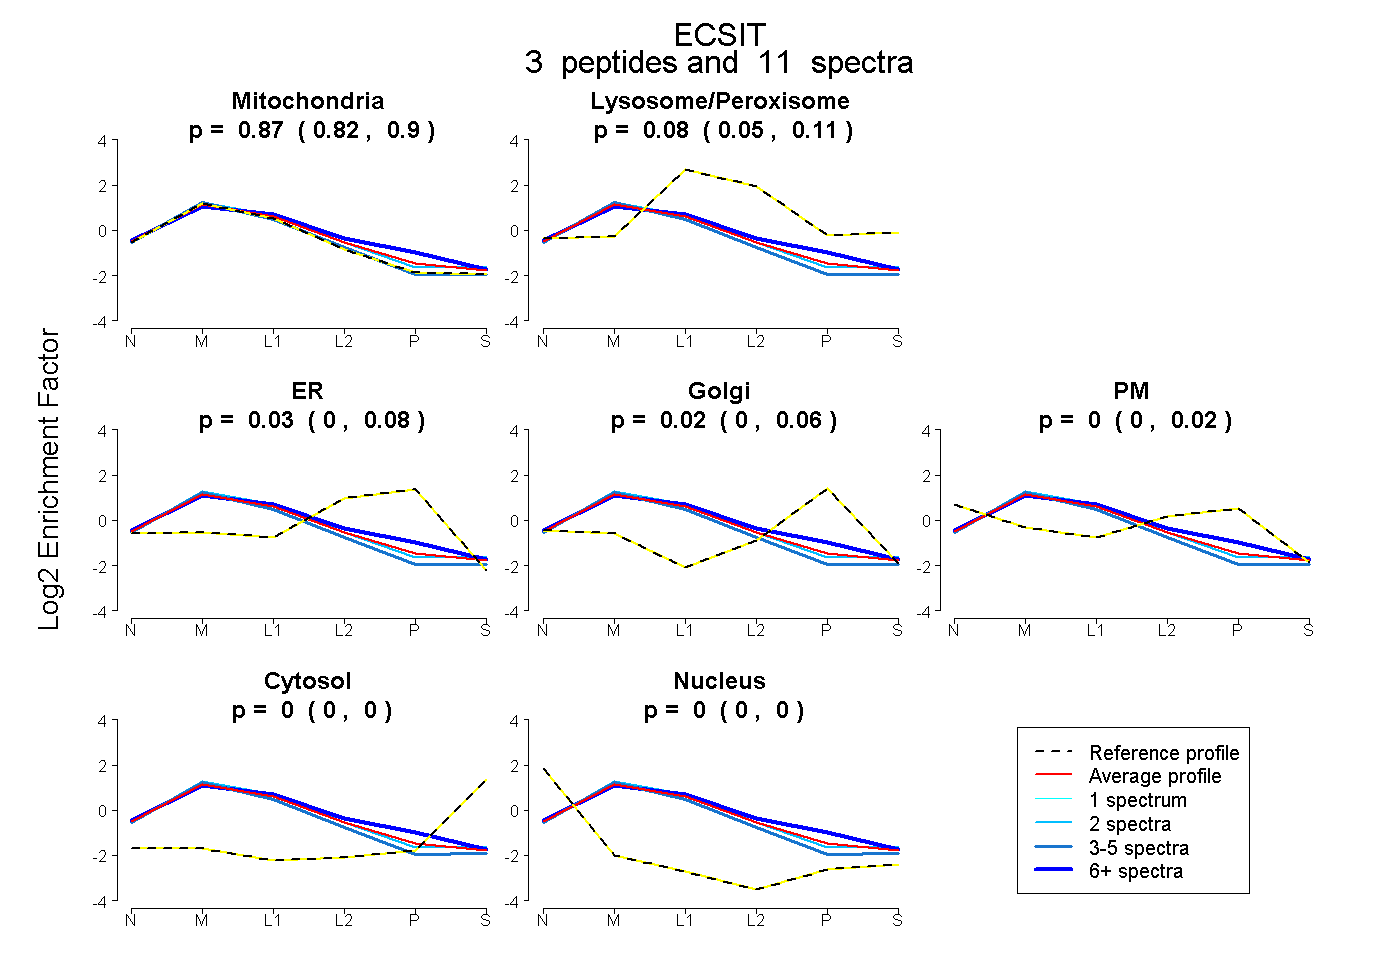 |
0.869 0.821 | 0.898 |
0.079 0.051 | 0.107 |
0.030 0.000 | 0.075 |
0.018 0.000 | 0.056 |
0.004 0.000 | 0.018 |
0.000 0.000 | 0.002 |
0.000 0.000 | 0.000 |
|||
| Plot | Lyso | Other | |||||||||||
| Expt C |
13 peptides |
61 spectra |
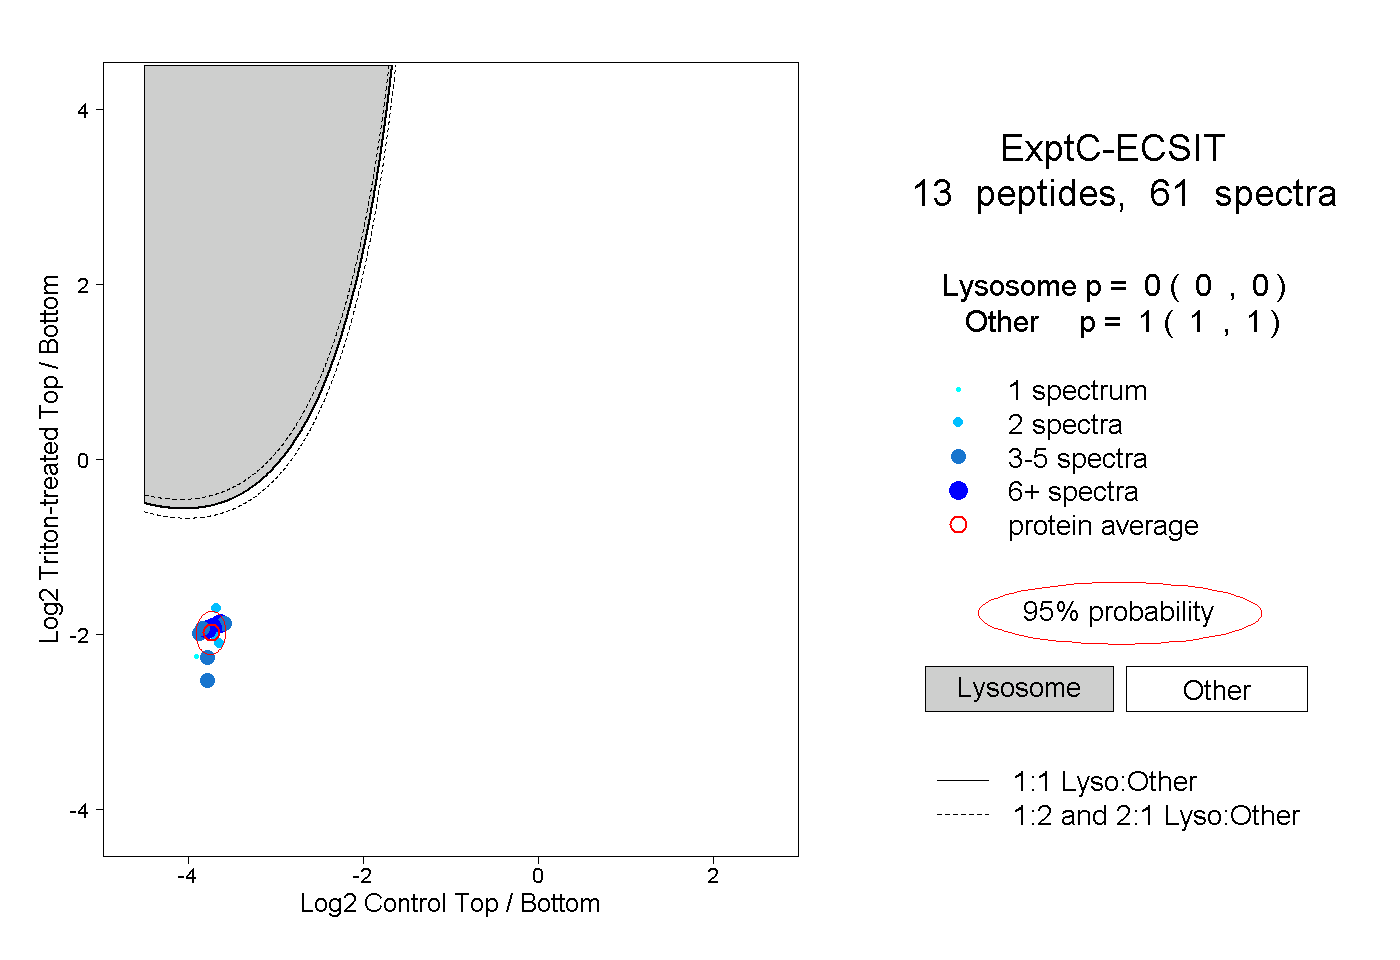 |
0.000 0.000 | 0.000 |
1.000 1.000 | 1.000 |
||||||||
| Plot | Lyso | Other | |||||||||||
| Expt D |
3 peptides |
6 spectra |
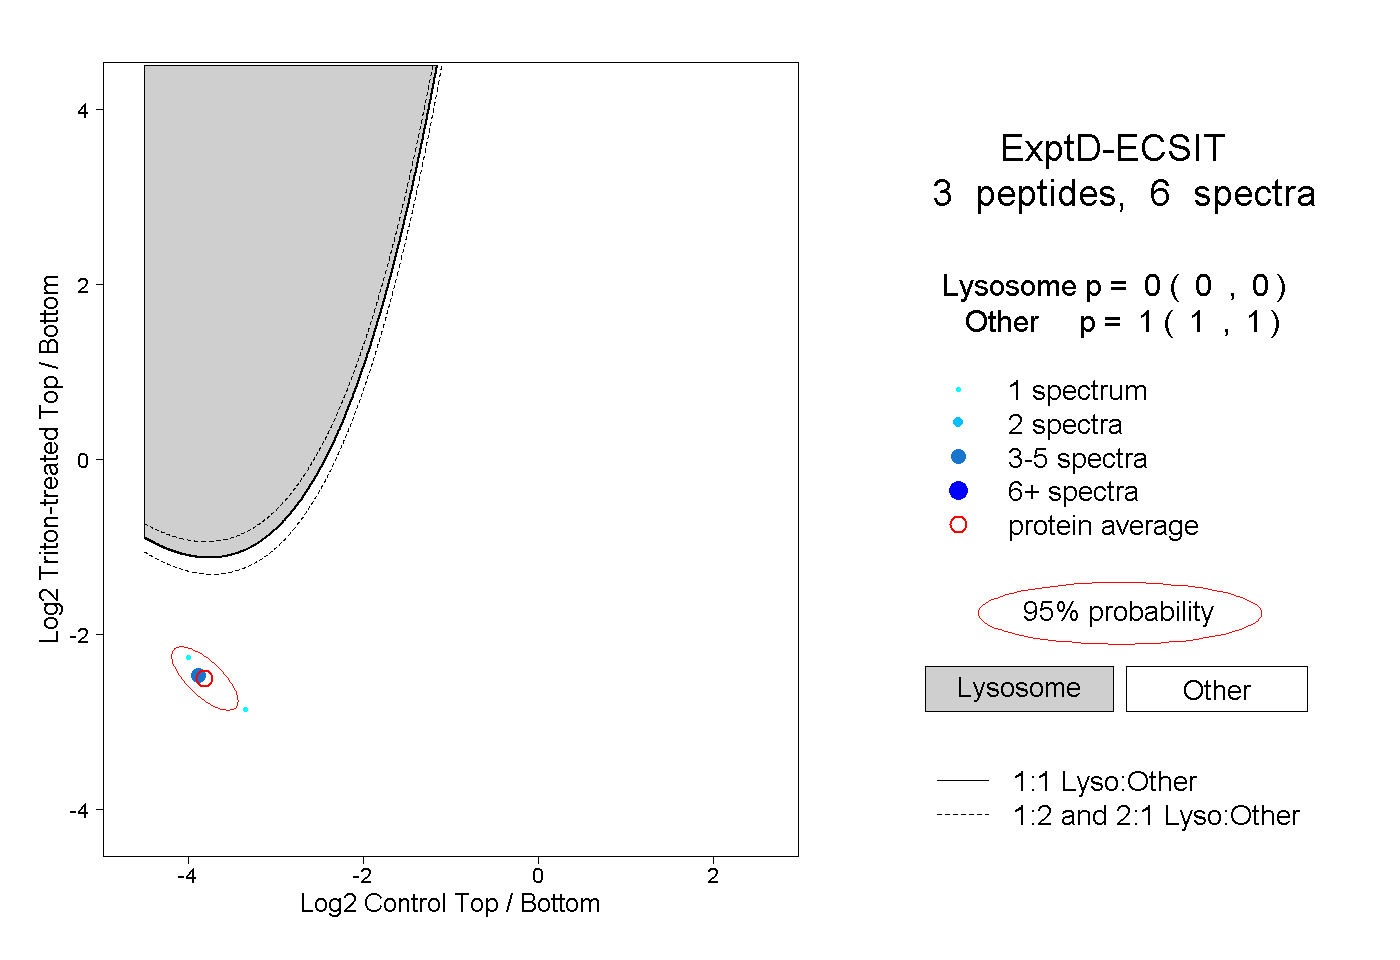 |
0.000 0.000 | 0.000 |
1.000 1.000 | 1.000 |