 14
14peptides
spectra
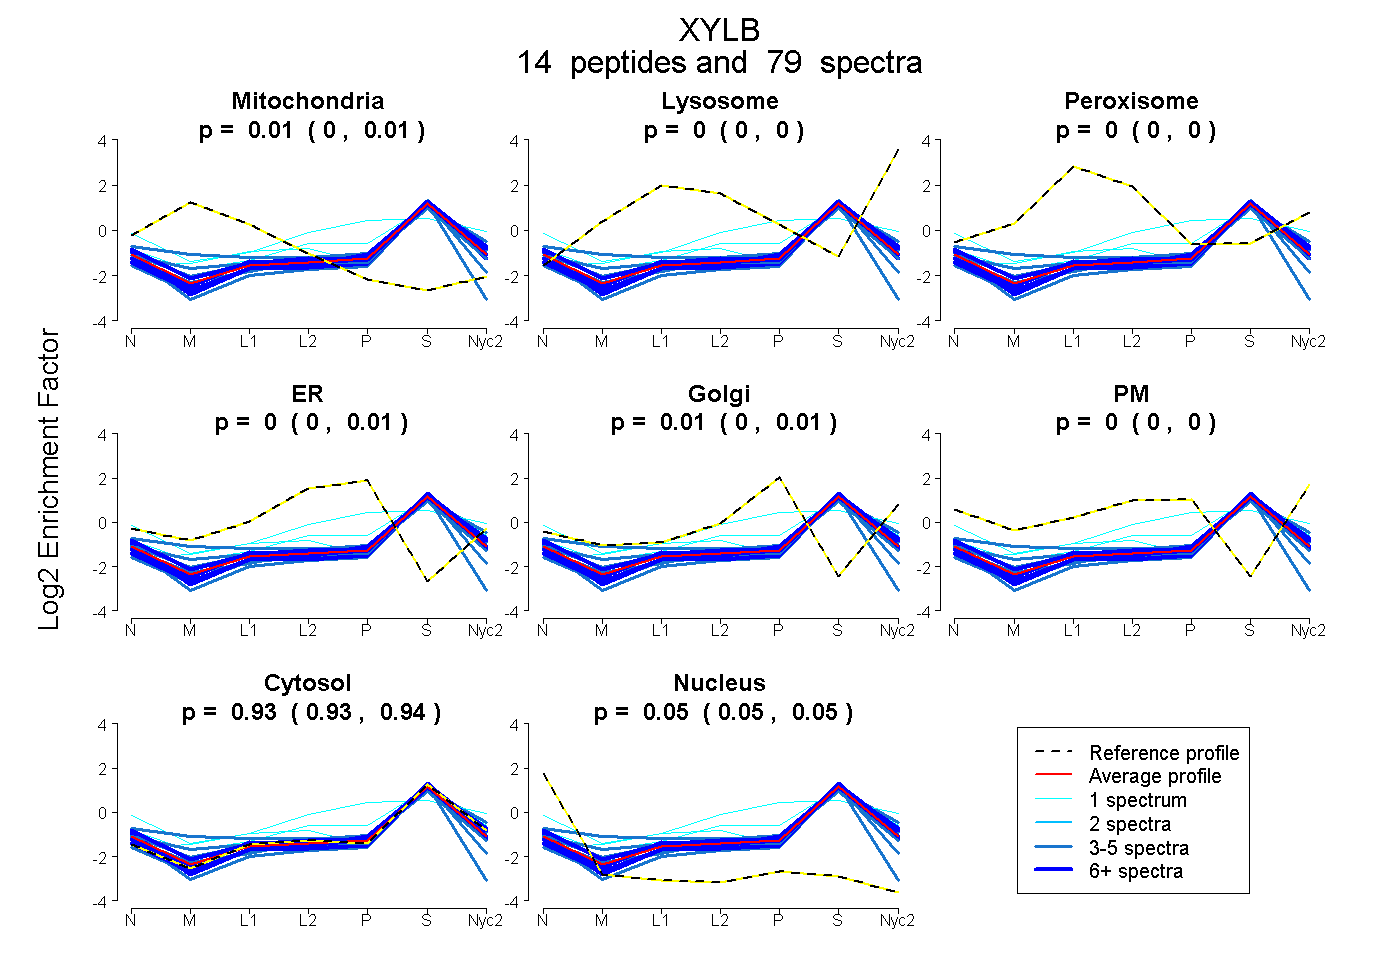
0.002 | 0.012
0.000 | 0.000
0.000 | 0.000
0.000 | 0.007
0.000 | 0.013
0.000 | 0.000
0.931 | 0.936
0.045 | 0.053
6peptides
spectra
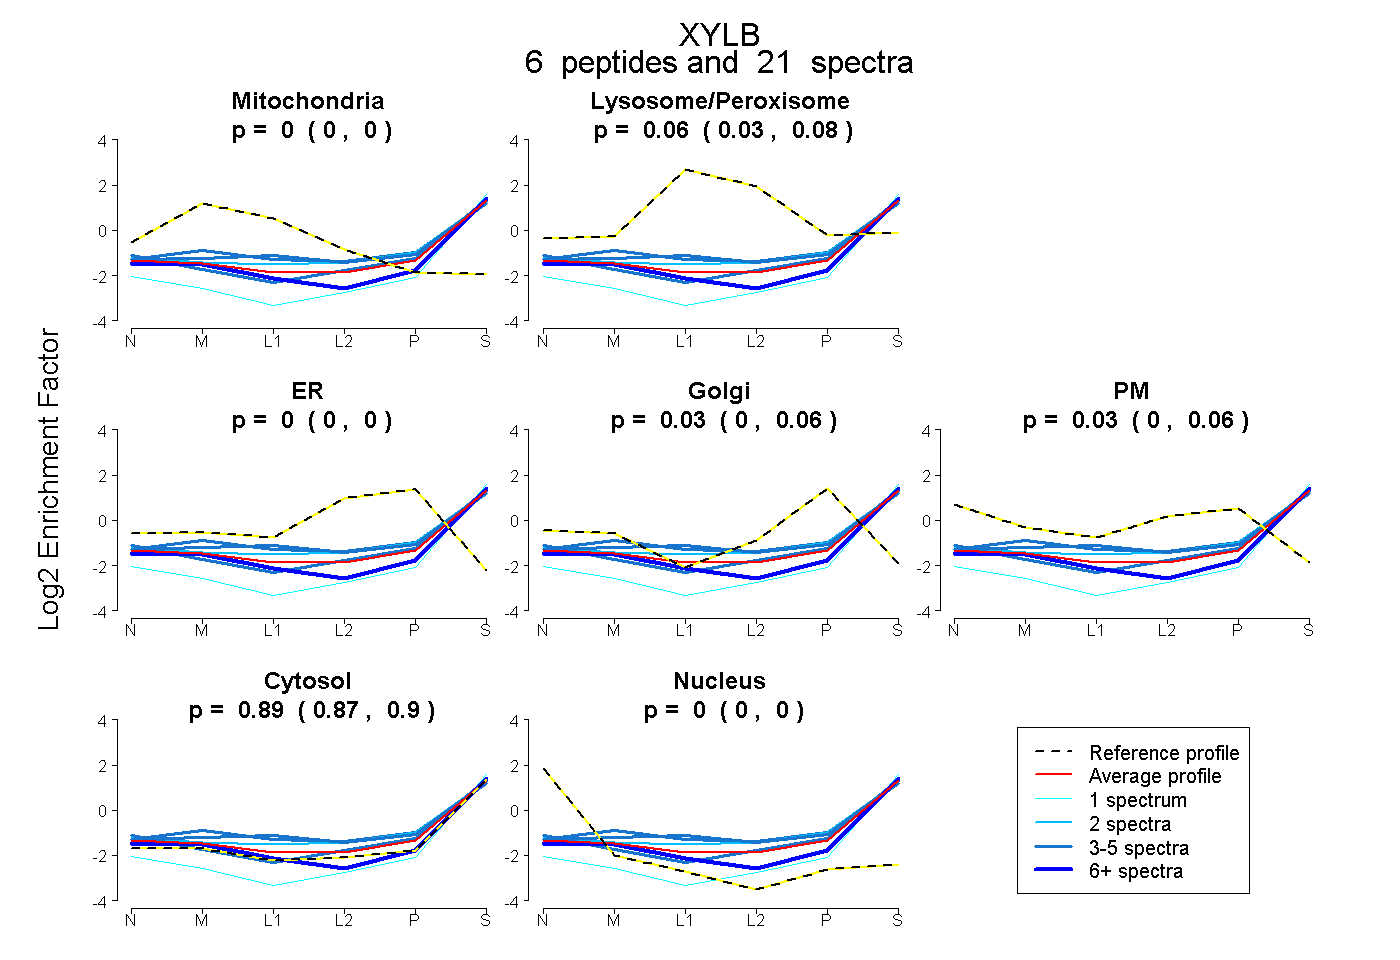
0.000 | 0.000
0.035 | 0.079
0.000 | 0.000
0.000 | 0.055
0.000 | 0.057
0.871 | 0.898
0.000 | 0.000
12peptides
spectra
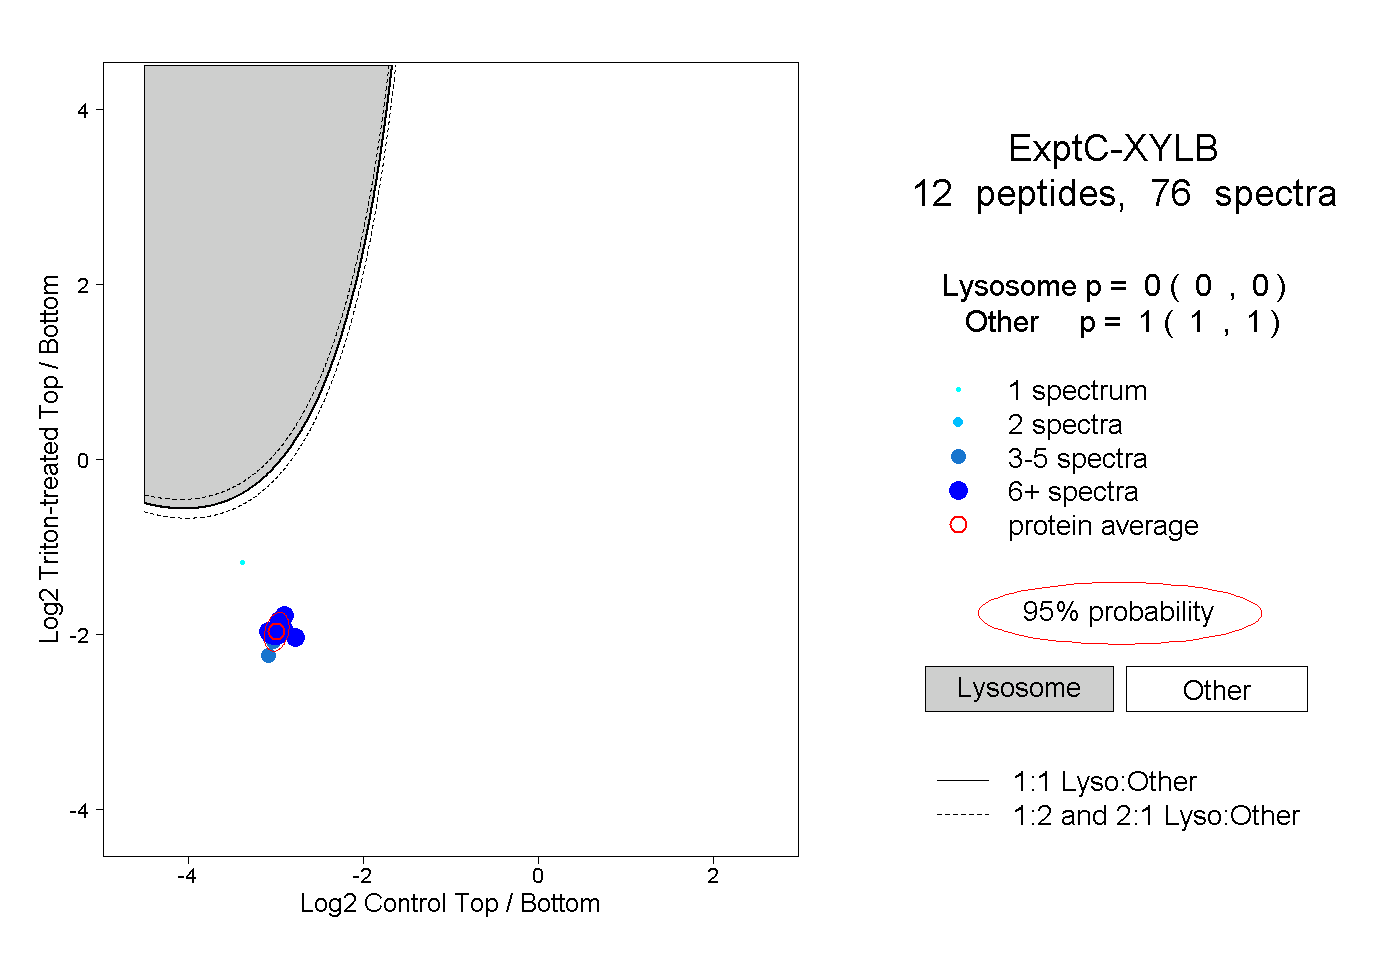
0.000 | 0.000
1.000 | 1.000
5peptides
spectra

0.000 | 0.190
0.806 | 1.000