 14
14peptides
spectra
0.002 | 0.012
0.000 | 0.000
0.000 | 0.000
0.000 | 0.007
0.000 | 0.013
0.000 | 0.000
0.931 | 0.936
0.045 | 0.053
| Plot | Mito | Lyso | Perox | ER | Golgi | PM | Cytosol | Nucleus | |||||
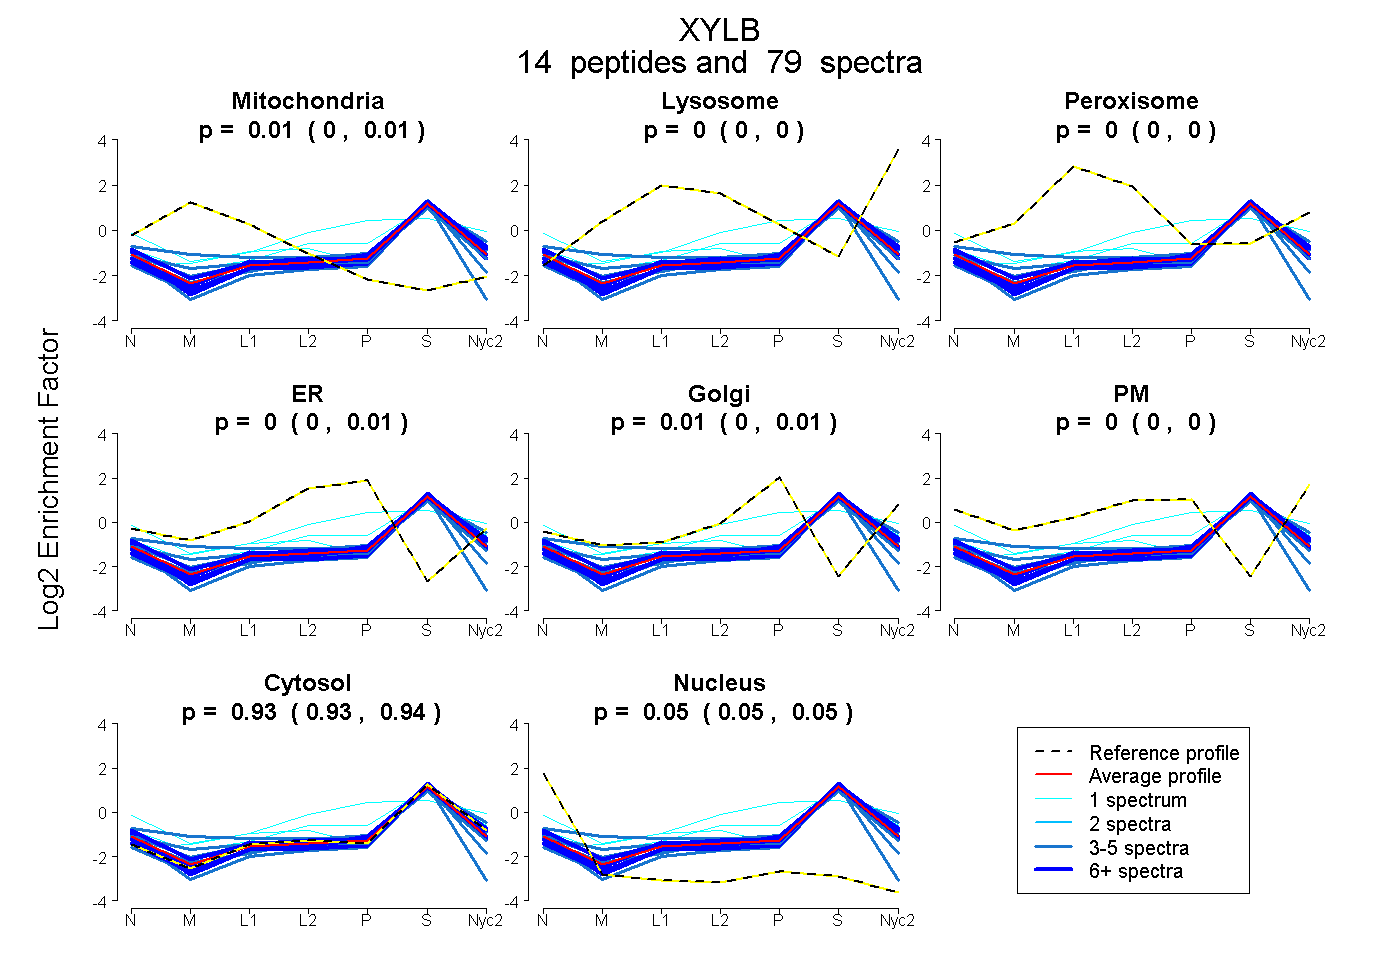
| Expt A |
14 peptides |
79 spectra |
|
0.008 0.002 | 0.012 |
0.000 0.000 | 0.000 |
0.000 0.000 | 0.000 |
0.000 0.000 | 0.007 |
0.009 0.000 | 0.013 |
0.000 0.000 | 0.000 |
0.933 0.931 | 0.936 |
0.049 0.045 | 0.053 |
| 4 spectra, IHAEGLGYR | 0.028 | 0.000 | 0.000 | 0.000 | 0.000 | 0.026 | 0.896 | 0.050 | ||
| 3 spectra, ALVEGQFMAK | 0.000 | 0.000 | 0.000 | 0.000 | 0.076 | 0.000 | 0.914 | 0.011 | ||
| 13 spectra, YAELEQR | 0.008 | 0.000 | 0.000 | 0.000 | 0.000 | 0.065 | 0.895 | 0.032 | ||
| 5 spectra, ILATGGASHNK | 0.000 | 0.000 | 0.000 | 0.000 | 0.000 | 0.000 | 0.910 | 0.090 | ||
| 5 spectra, FTGNQISK | 0.029 | 0.000 | 0.000 | 0.000 | 0.059 | 0.019 | 0.884 | 0.008 | ||
| 3 spectra, QYMALLCFK | 0.221 | 0.000 | 0.017 | 0.000 | 0.000 | 0.000 | 0.762 | 0.000 | ||
| 12 spectra, NPEAYSNSER | 0.000 | 0.000 | 0.000 | 0.000 | 0.000 | 0.000 | 0.918 | 0.082 | ||
| 3 spectra, FNADNMEVSAFPGDVEIR | 0.000 | 0.000 | 0.000 | 0.000 | 0.000 | 0.000 | 0.927 | 0.073 | ||
| 11 spectra, VVAFTGDNPASLAGMR | 0.000 | 0.000 | 0.000 | 0.000 | 0.000 | 0.000 | 0.957 | 0.043 | ||
| 3 spectra, VWSQACLDACAPHLK | 0.113 | 0.000 | 0.000 | 0.000 | 0.000 | 0.000 | 0.762 | 0.125 | ||
| 1 spectrum, AFHGLAGGTGVAFSEVVK | 0.052 | 0.003 | 0.123 | 0.000 | 0.000 | 0.000 | 0.823 | 0.000 | ||
| 14 spectra, YGFPPGCK | 0.000 | 0.000 | 0.000 | 0.000 | 0.006 | 0.005 | 0.976 | 0.013 | ||
| 1 spectrum, DESASCSWNK | 0.000 | 0.000 | 0.000 | 0.118 | 0.021 | 0.288 | 0.572 | 0.000 | ||
| 1 spectrum, DLPEFGTQGGVHVHK | 0.000 | 0.000 | 0.026 | 0.089 | 0.000 | 0.083 | 0.802 | 0.000 |
| Plot | Mito | Lyso or Perox | ER | Golgi | PM | Cytosol | Nucleus | ||||||
| Expt B |
6 peptides |
21 spectra |
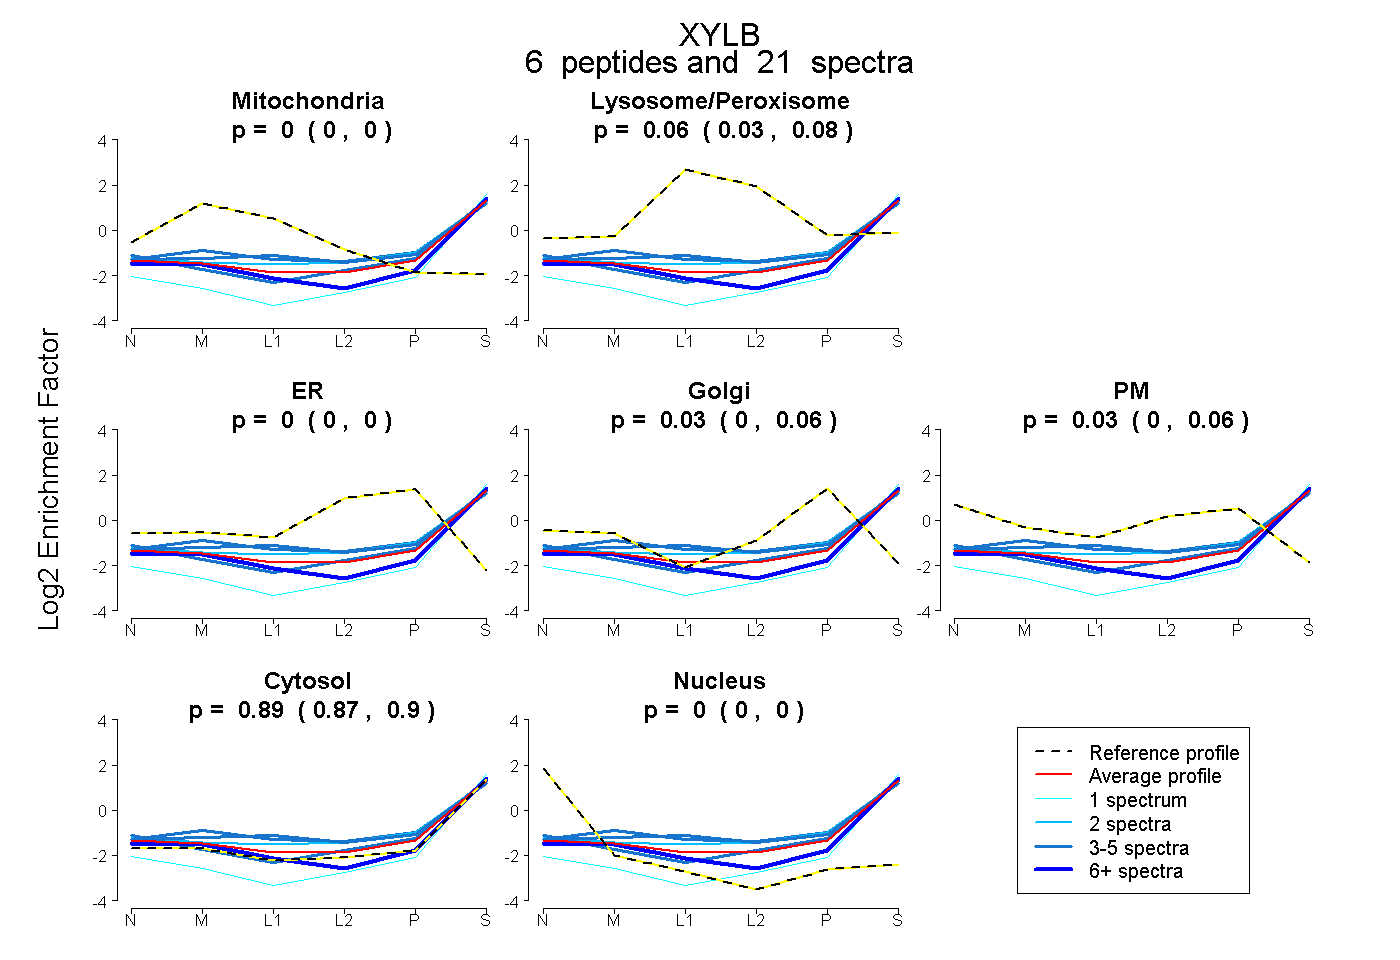 |
0.000 0.000 | 0.000 |
0.059 0.035 | 0.079 |
0.000 0.000 | 0.000 |
0.028 0.000 | 0.055 |
0.028 0.000 | 0.057 |
0.886 0.871 | 0.898 |
0.000 0.000 | 0.000 |
|||
| Plot | Lyso | Other | |||||||||||
| Expt C |
12 peptides |
76 spectra |
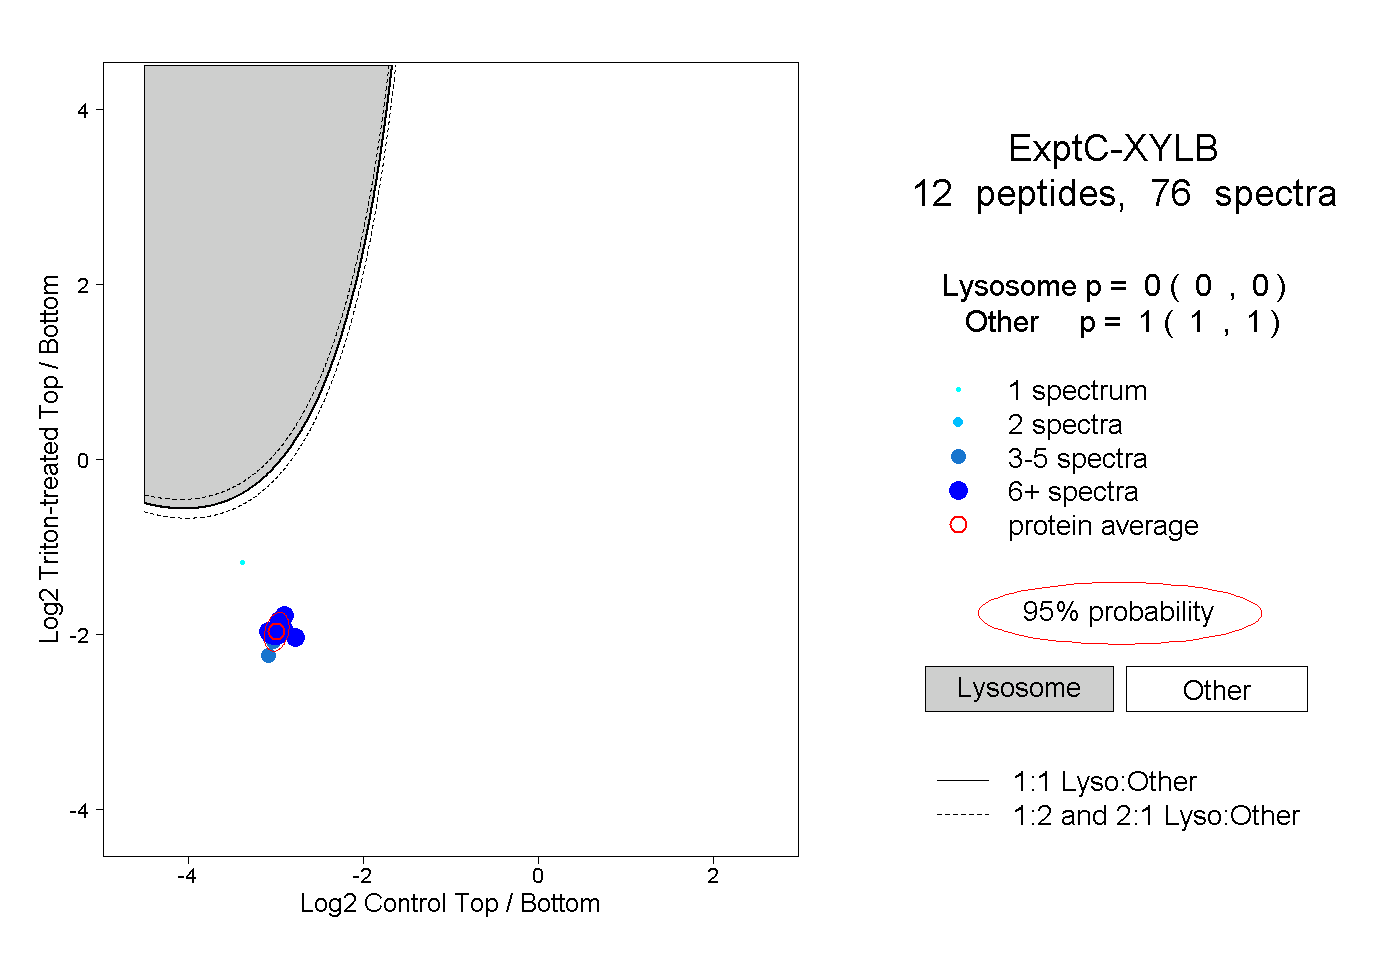 |
0.000 0.000 | 0.000 |
1.000 1.000 | 1.000 |
||||||||
| Plot | Lyso | Other | |||||||||||
| Expt D |
5 peptides |
8 spectra |
 |
0.003 0.000 | 0.190 |
0.997 0.806 | 1.000 |