 6
6peptides
spectra
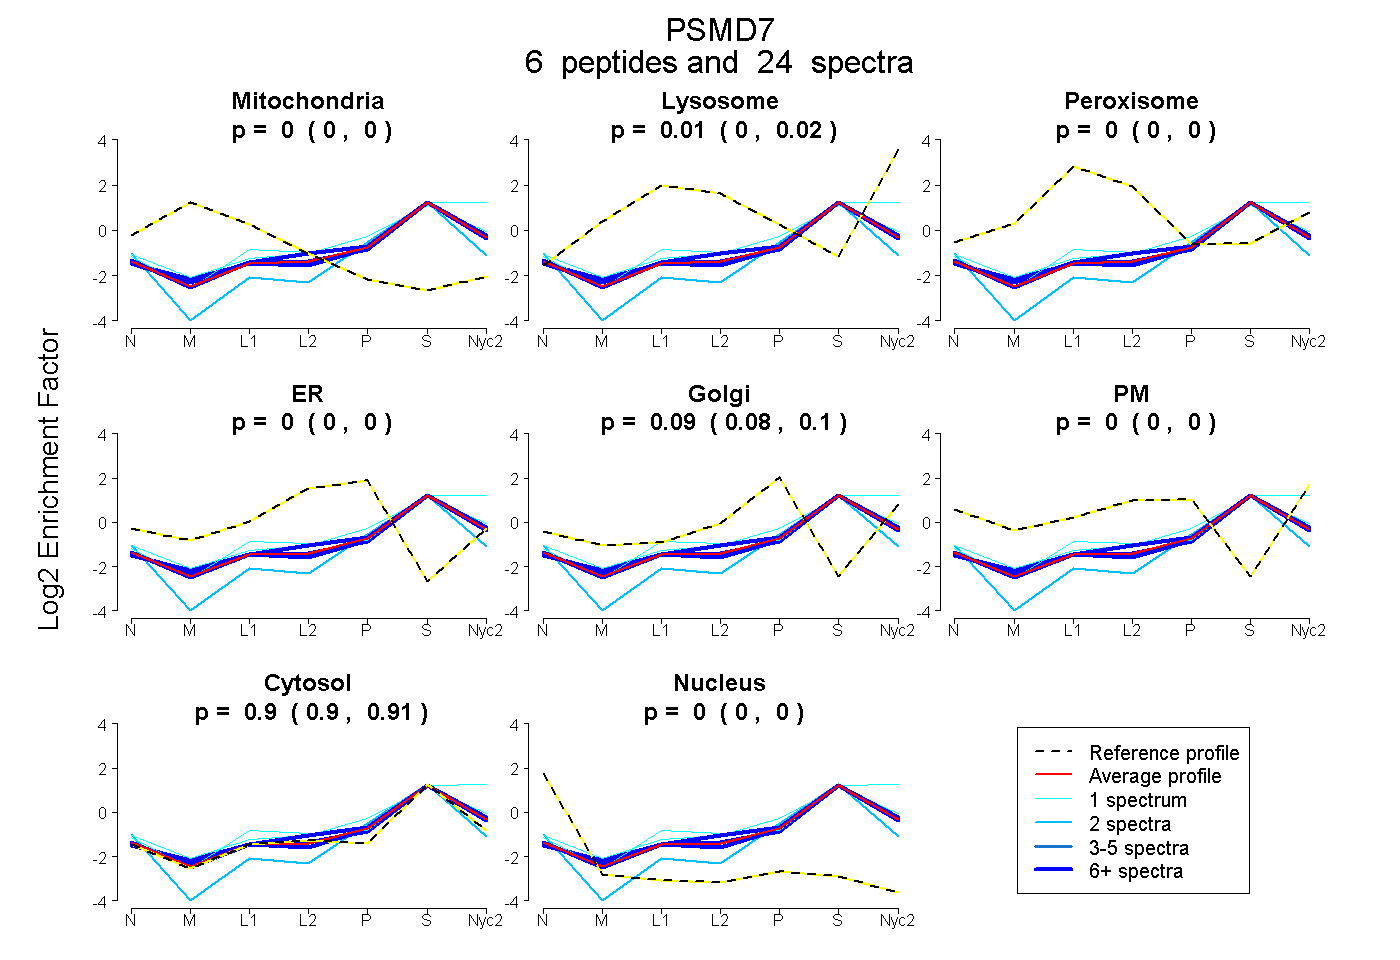
0.000 | 0.000
0.000 | 0.015
0.000 | 0.000
0.000 | 0.000
0.084 | 0.097
0.000 | 0.000
0.896 | 0.907
0.000 | 0.000
2peptides
spectra
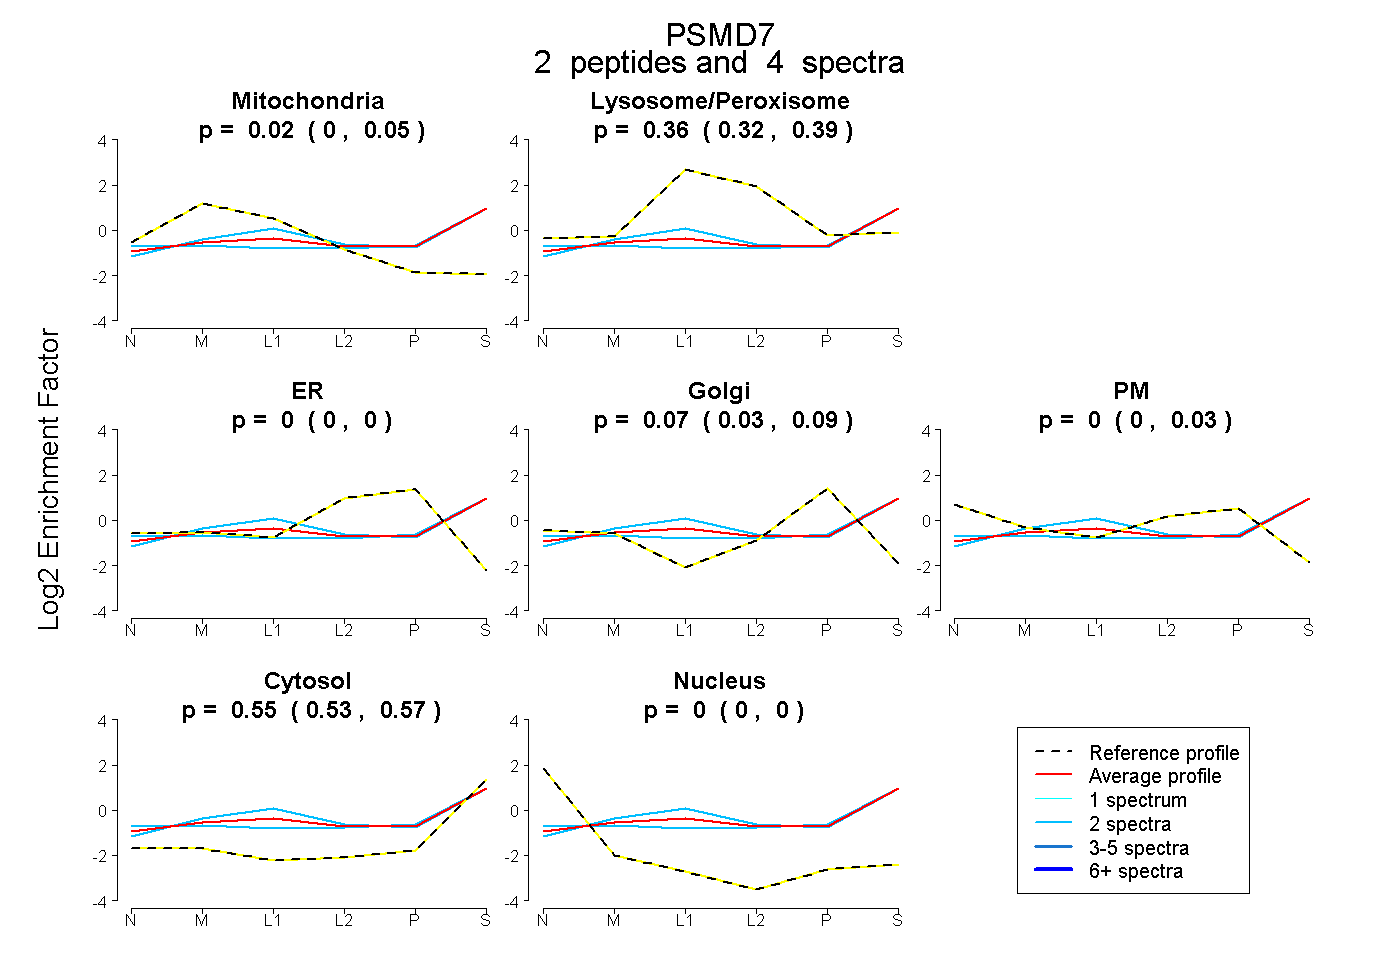
0.000 | 0.045
0.317 | 0.394
0.000 | 0.000
0.030 | 0.093
0.000 | 0.027
0.529 | 0.569
0.000 | 0.000
5peptides
spectra
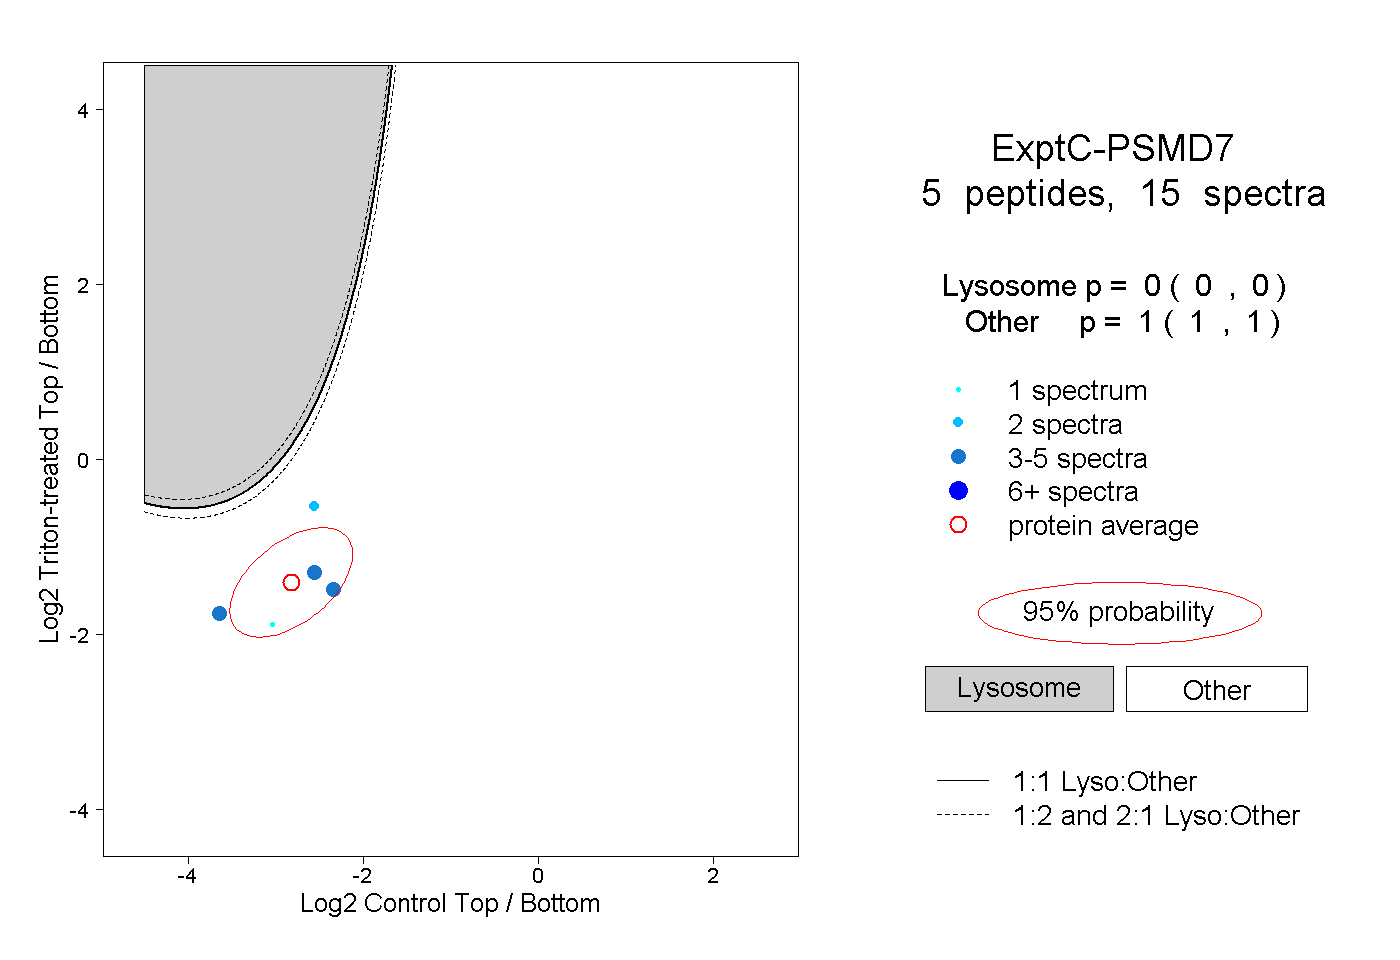
0.000 | 0.000
1.000 | 1.000