 6
6peptides
spectra
0.000 | 0.000
0.000 | 0.015
0.000 | 0.000
0.000 | 0.000
0.084 | 0.097
0.000 | 0.000
0.896 | 0.907
0.000 | 0.000
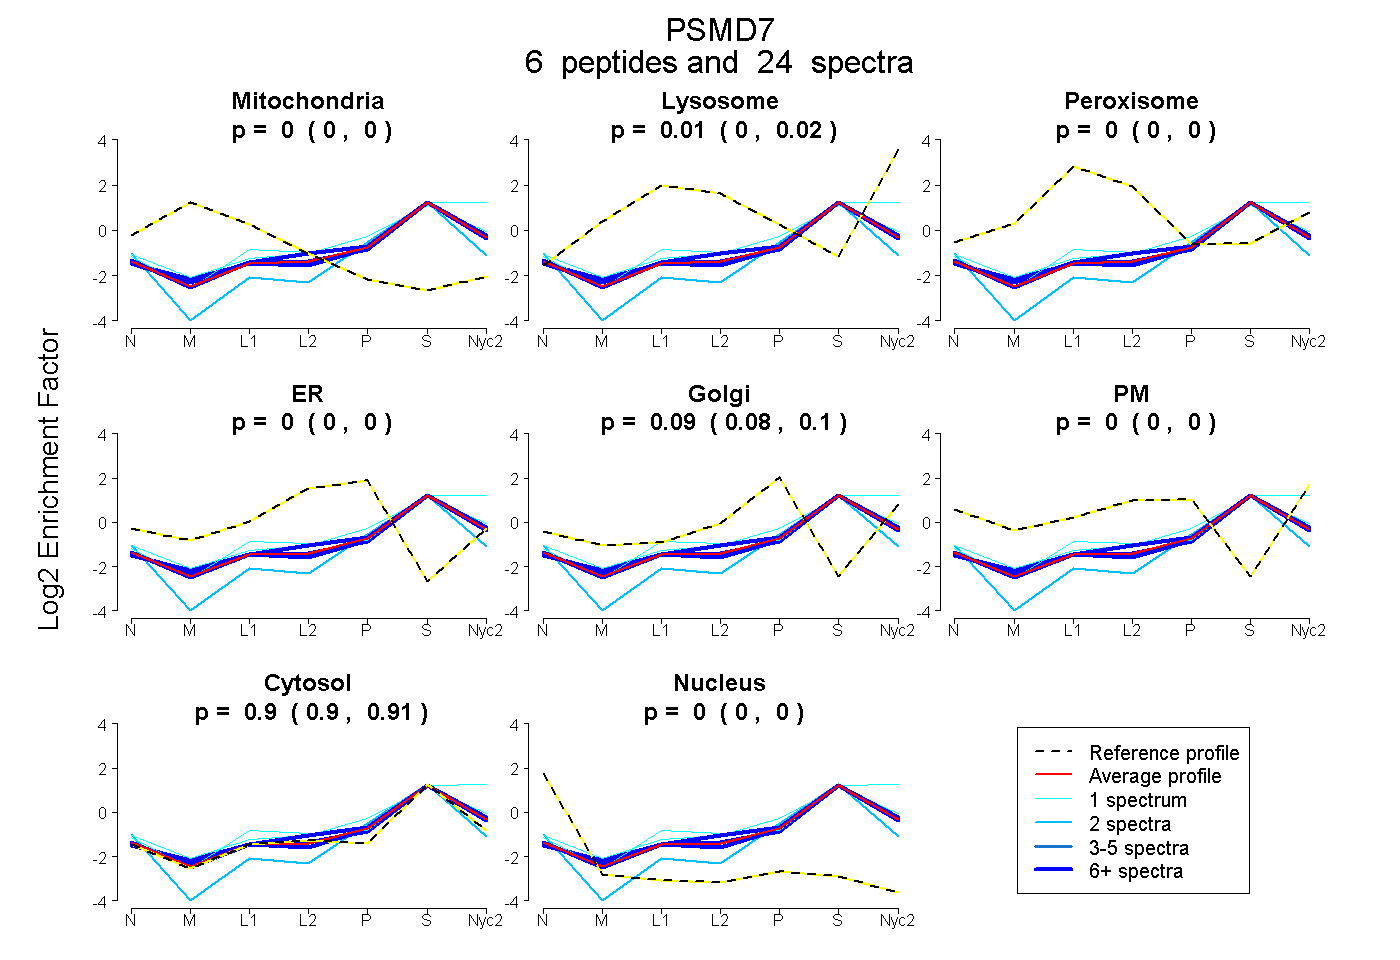
| Plot | Mito | Lyso | Perox | ER | Golgi | PM | Cytosol | Nucleus | |||||
| Expt A |
6 peptides |
24 spectra |
|
0.000 0.000 | 0.000 |
0.006 0.000 | 0.015 |
0.000 0.000 | 0.000 |
0.000 0.000 | 0.000 |
0.091 0.084 | 0.097 |
0.000 0.000 | 0.000 |
0.902 0.896 | 0.907 |
0.000 0.000 | 0.000 |
| 1 spectrum, PELAVQK | 0.000 | 0.059 | 0.000 | 0.000 | 0.157 | 0.000 | 0.784 | 0.000 | ||
| 2 spectra, DTTVGTLSQR | 0.000 | 0.000 | 0.000 | 0.000 | 0.000 | 0.000 | 0.898 | 0.102 | ||
| 6 spectra, SVVALHNLINNK | 0.000 | 0.034 | 0.000 | 0.000 | 0.086 | 0.000 | 0.880 | 0.000 | ||
| 7 spectra, IVGWYHTGPK | 0.000 | 0.014 | 0.000 | 0.000 | 0.080 | 0.000 | 0.906 | 0.000 | ||
| 7 spectra, ITNQVHGLK | 0.000 | 0.025 | 0.000 | 0.000 | 0.064 | 0.000 | 0.910 | 0.000 | ||
| 1 spectrum, NDIAINELMK | 0.000 | 0.230 | 0.000 | 0.000 | 0.000 | 0.000 | 0.770 | 0.000 |
| Plot | Mito | Lyso or Perox | ER | Golgi | PM | Cytosol | Nucleus | ||||||
| Expt B |
2 peptides |
4 spectra |
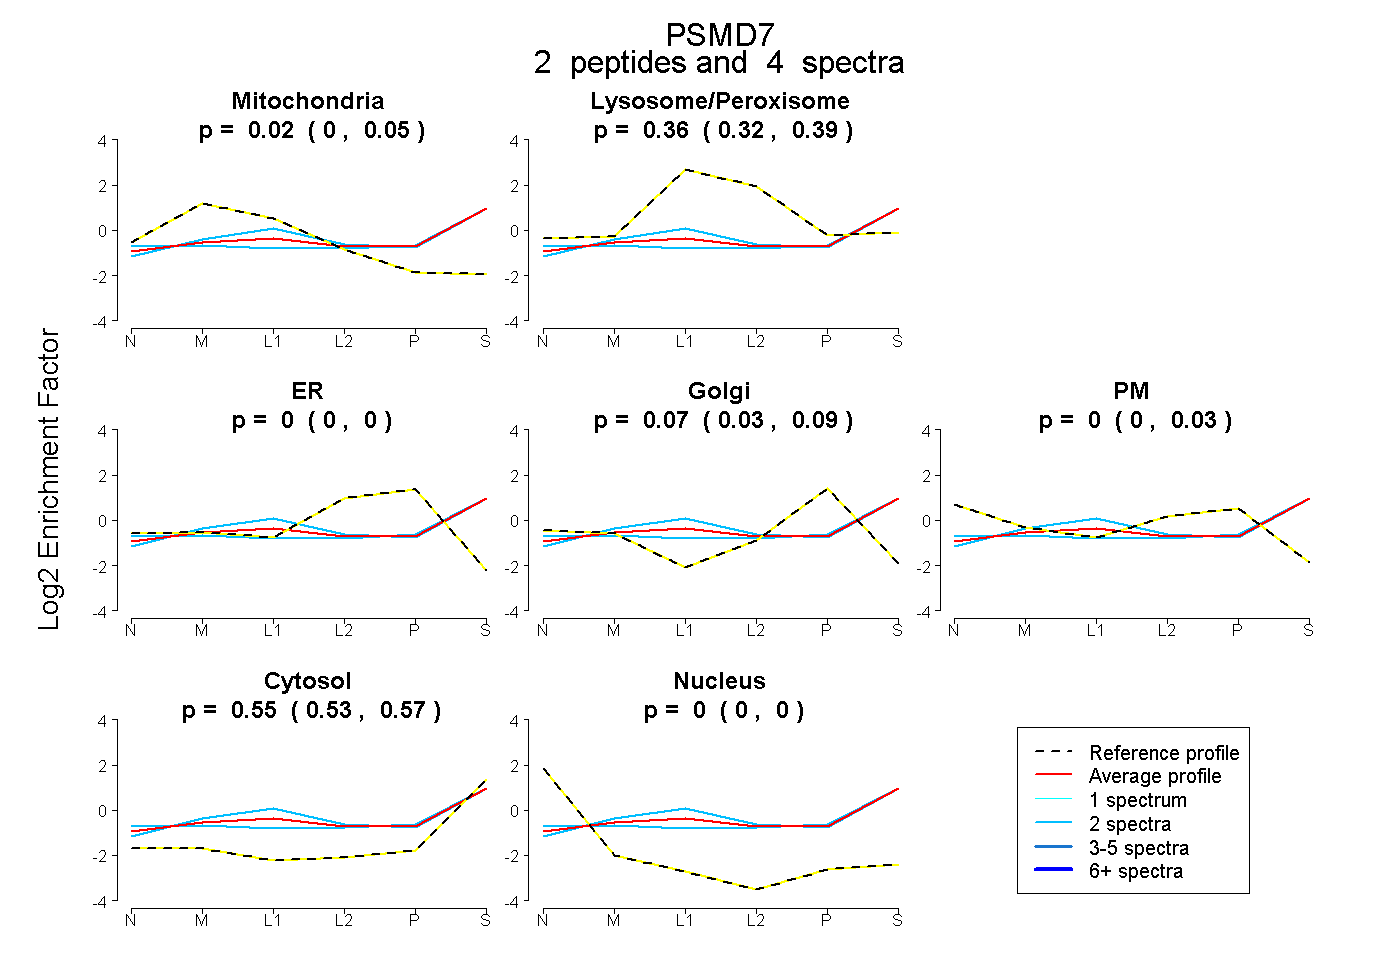 |
0.020 0.000 | 0.045 |
0.362 0.317 | 0.394 |
0.000 0.000 | 0.000 |
0.069 0.030 | 0.093 |
0.000 0.000 | 0.027 |
0.549 0.529 | 0.569 |
0.000 0.000 | 0.000 |
|||
| Plot | Lyso | Other | |||||||||||
| Expt C |
5 peptides |
15 spectra |
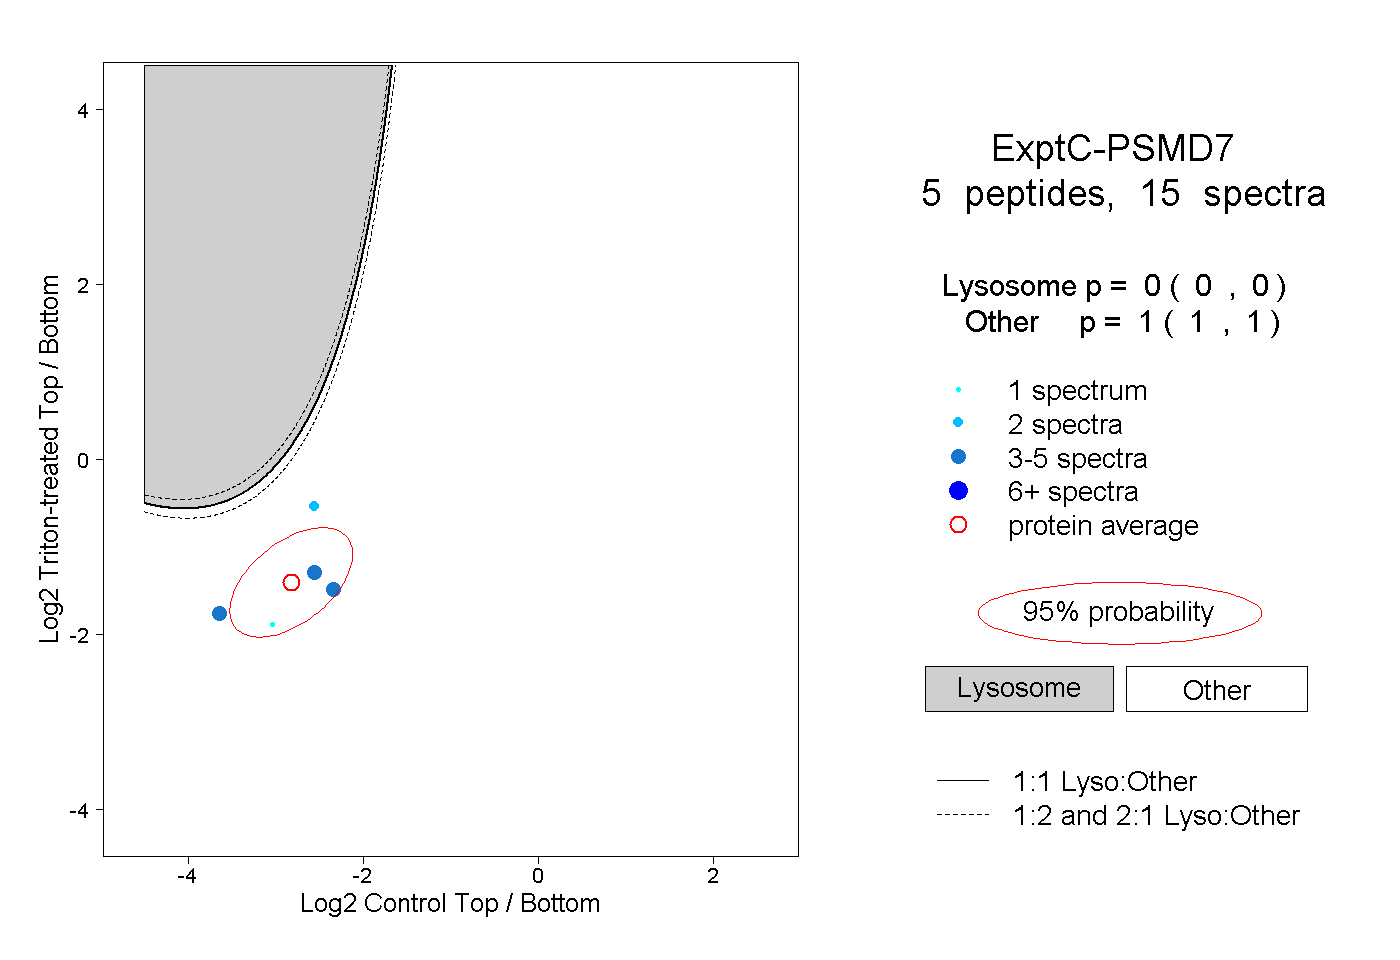 |
0.000 0.000 | 0.000 |
1.000 1.000 | 1.000 |