 5
5peptides
spectra
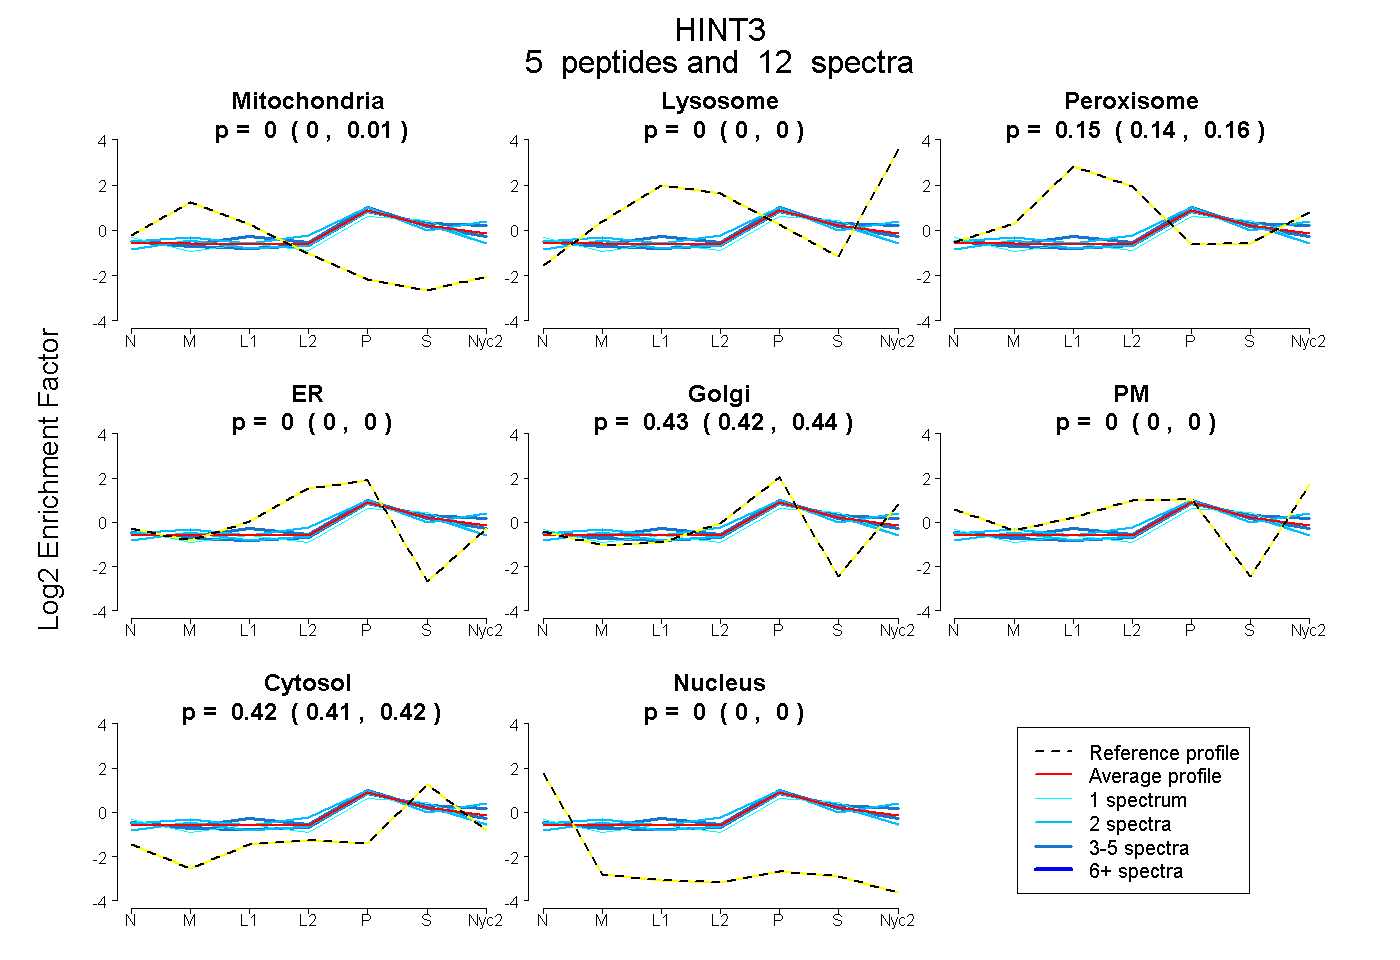
0.000 | 0.008
0.000 | 0.000
0.140 | 0.162
0.000 | 0.000
0.420 | 0.438
0.000 | 0.000
0.407 | 0.423
0.000 | 0.000
2peptides
spectra
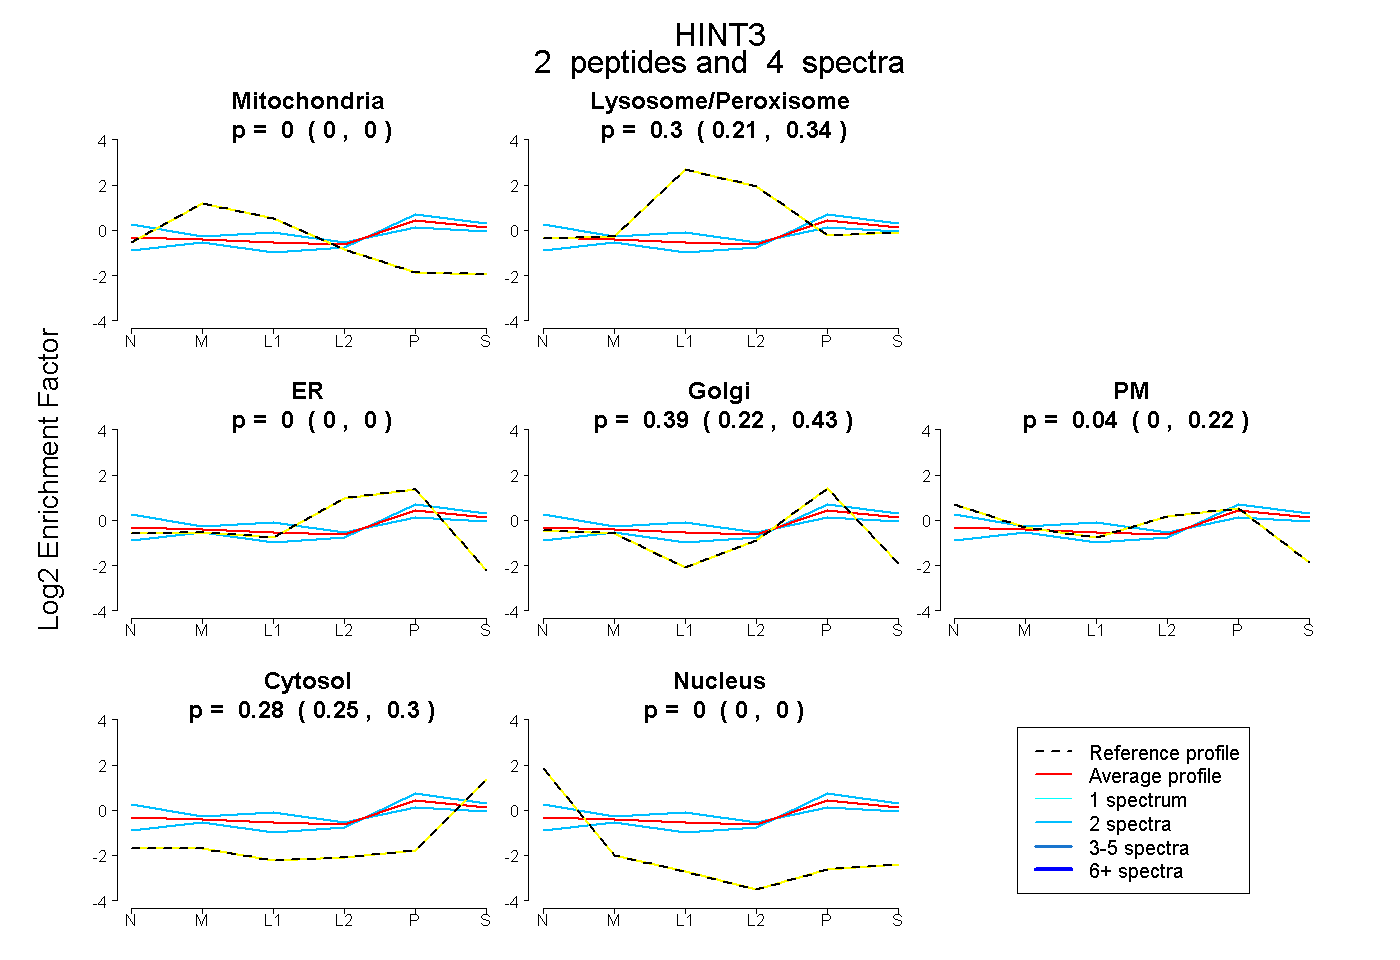
0.000 | 0.000
0.215 | 0.341
0.000 | 0.000
0.215 | 0.433
0.000 | 0.223
0.245 | 0.304
0.000 | 0.000
6peptides
spectra
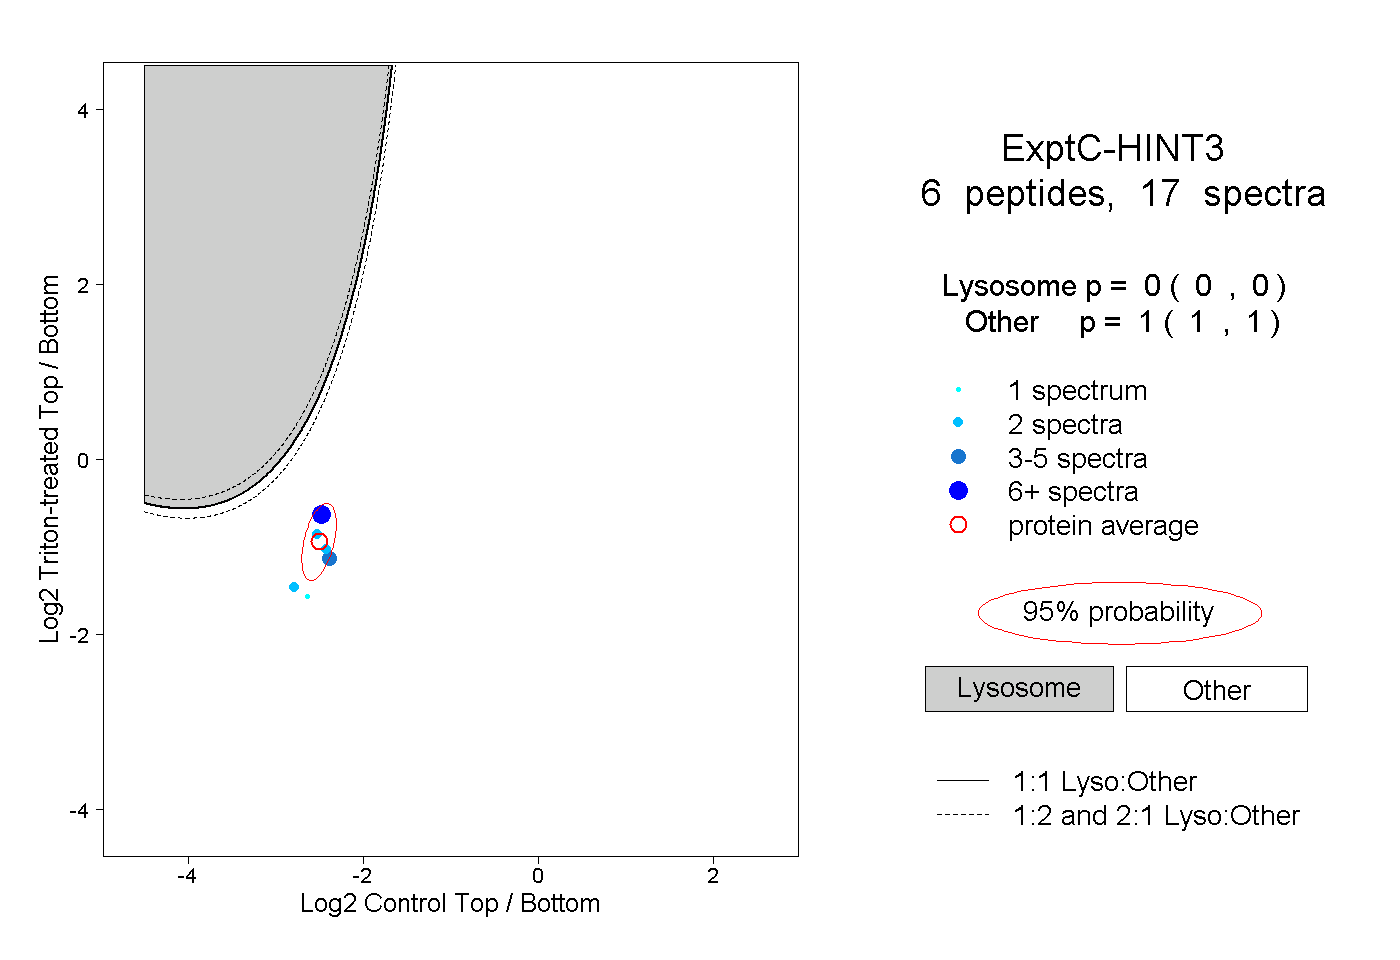
0.000 | 0.000
1.000 | 1.000
2peptides
spectra
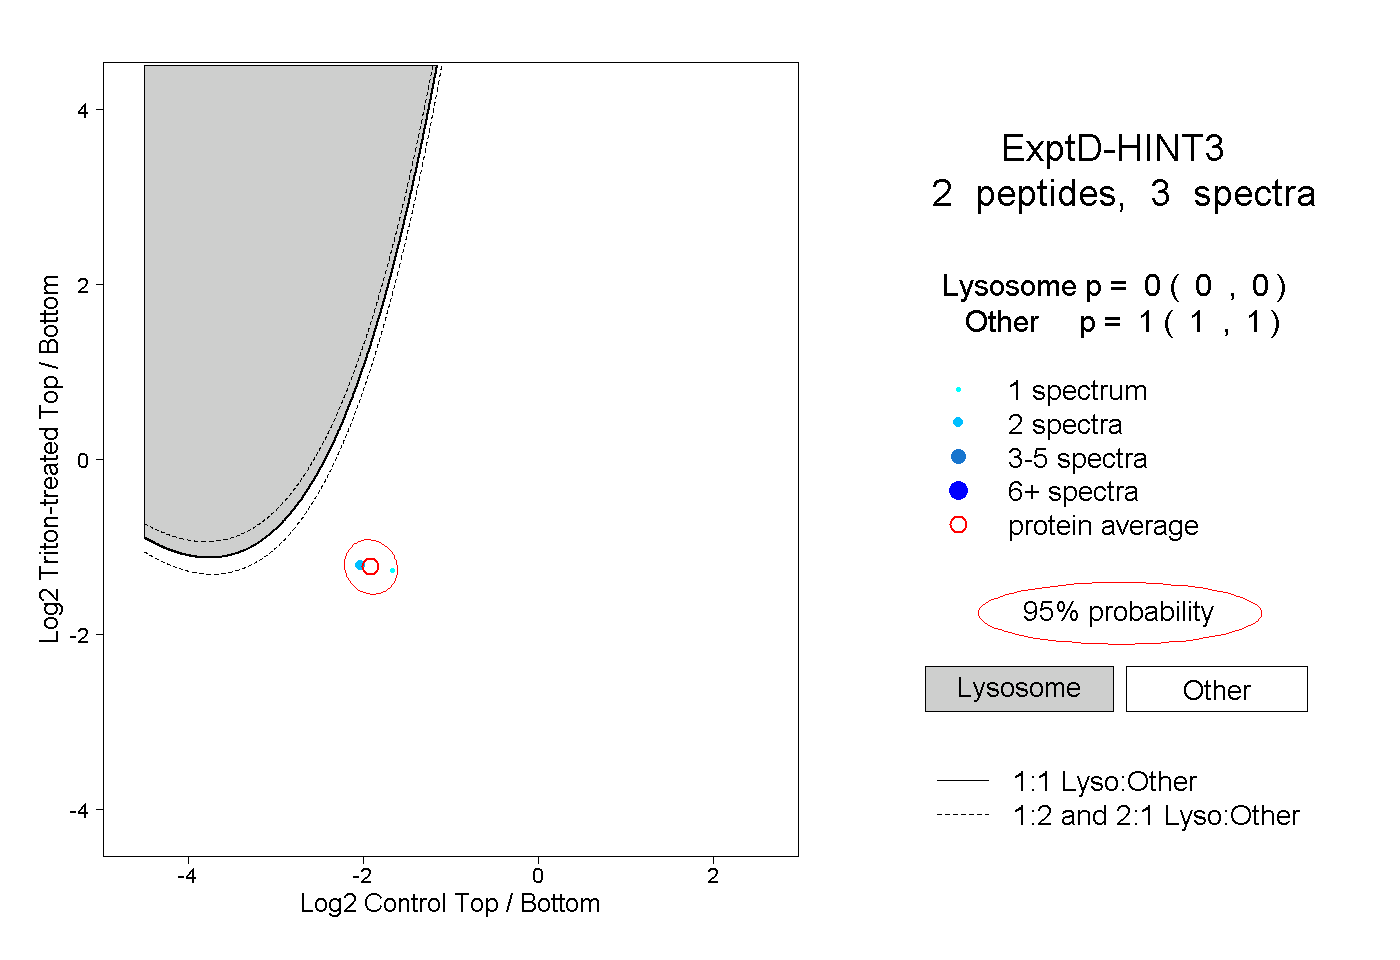
0.000 | 0.000
1.000 | 1.000