 5
5peptides
spectra
0.000 | 0.008
0.000 | 0.000
0.140 | 0.162
0.000 | 0.000
0.420 | 0.438
0.000 | 0.000
0.407 | 0.423
0.000 | 0.000
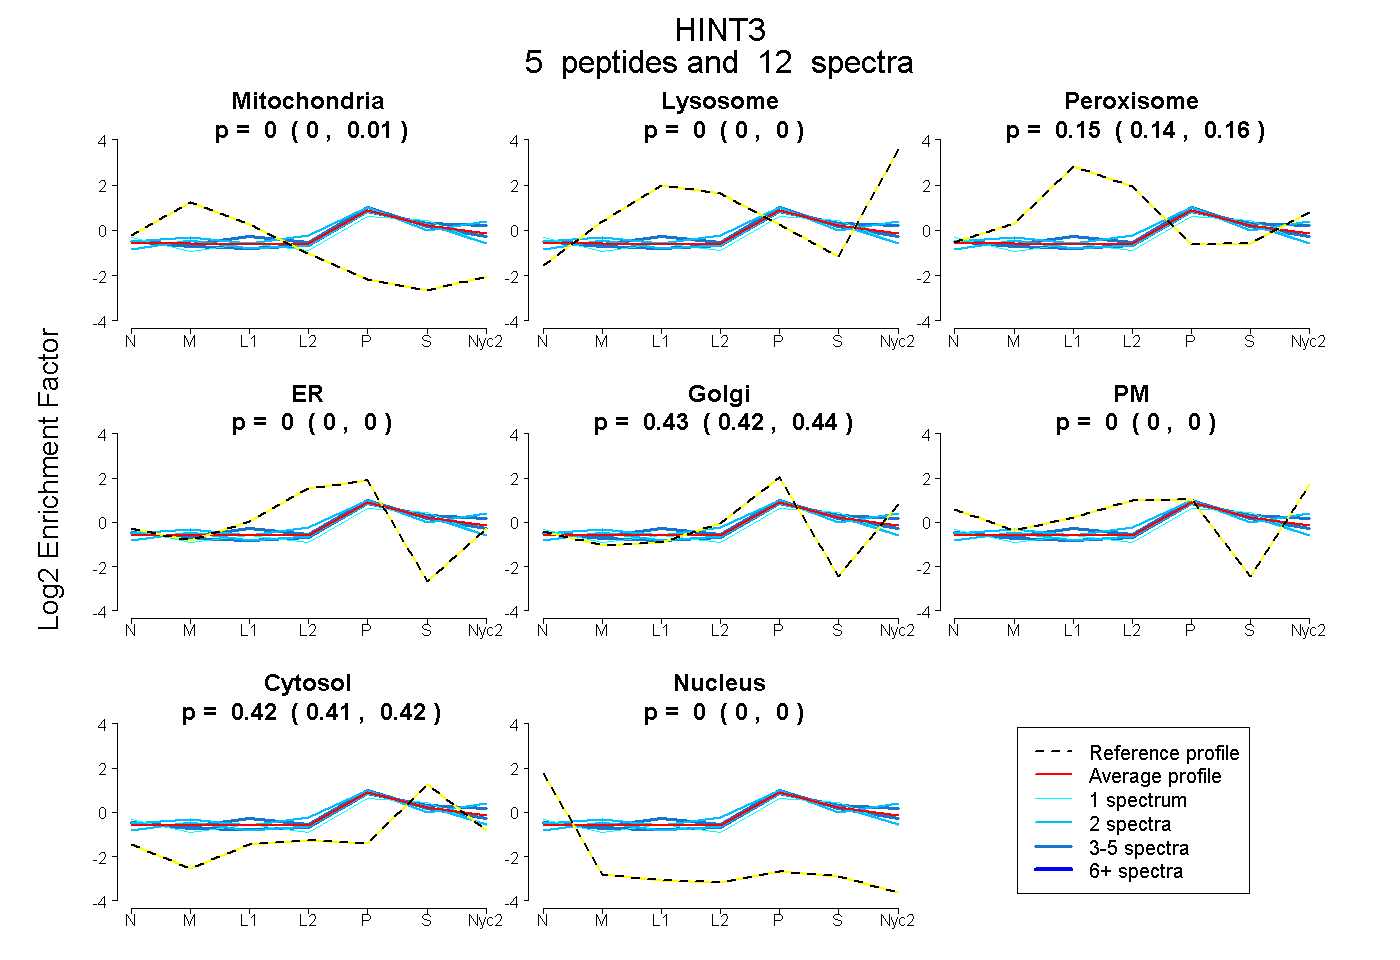
| Plot | Mito | Lyso | Perox | ER | Golgi | PM | Cytosol | Nucleus | |||||
| Expt A |
5 peptides |
12 spectra |
|
0.000 0.000 | 0.008 |
0.000 0.000 | 0.000 |
0.153 0.140 | 0.162 |
0.000 0.000 | 0.000 |
0.431 0.420 | 0.438 |
0.000 0.000 | 0.000 |
0.416 0.407 | 0.423 |
0.000 0.000 | 0.000 |
| 2 spectra, VAAGQEPETELLYCENK | 0.060 | 0.000 | 0.094 | 0.011 | 0.392 | 0.000 | 0.442 | 0.000 | ||
| 3 spectra, AGPEVSSPGTSESR | 0.000 | 0.000 | 0.191 | 0.000 | 0.419 | 0.000 | 0.390 | 0.000 | ||
| 4 spectra, EFGFLSR | 0.000 | 0.025 | 0.102 | 0.000 | 0.435 | 0.000 | 0.438 | 0.000 | ||
| 1 spectrum, QAGLAGEPNPDCTVTAK | 0.041 | 0.000 | 0.110 | 0.000 | 0.349 | 0.000 | 0.500 | 0.000 | ||
| 2 spectra, NNFTDFTDVR | 0.000 | 0.050 | 0.158 | 0.000 | 0.467 | 0.000 | 0.325 | 0.000 |
| Plot | Mito | Lyso or Perox | ER | Golgi | PM | Cytosol | Nucleus | ||||||
| Expt B |
2 peptides |
4 spectra |
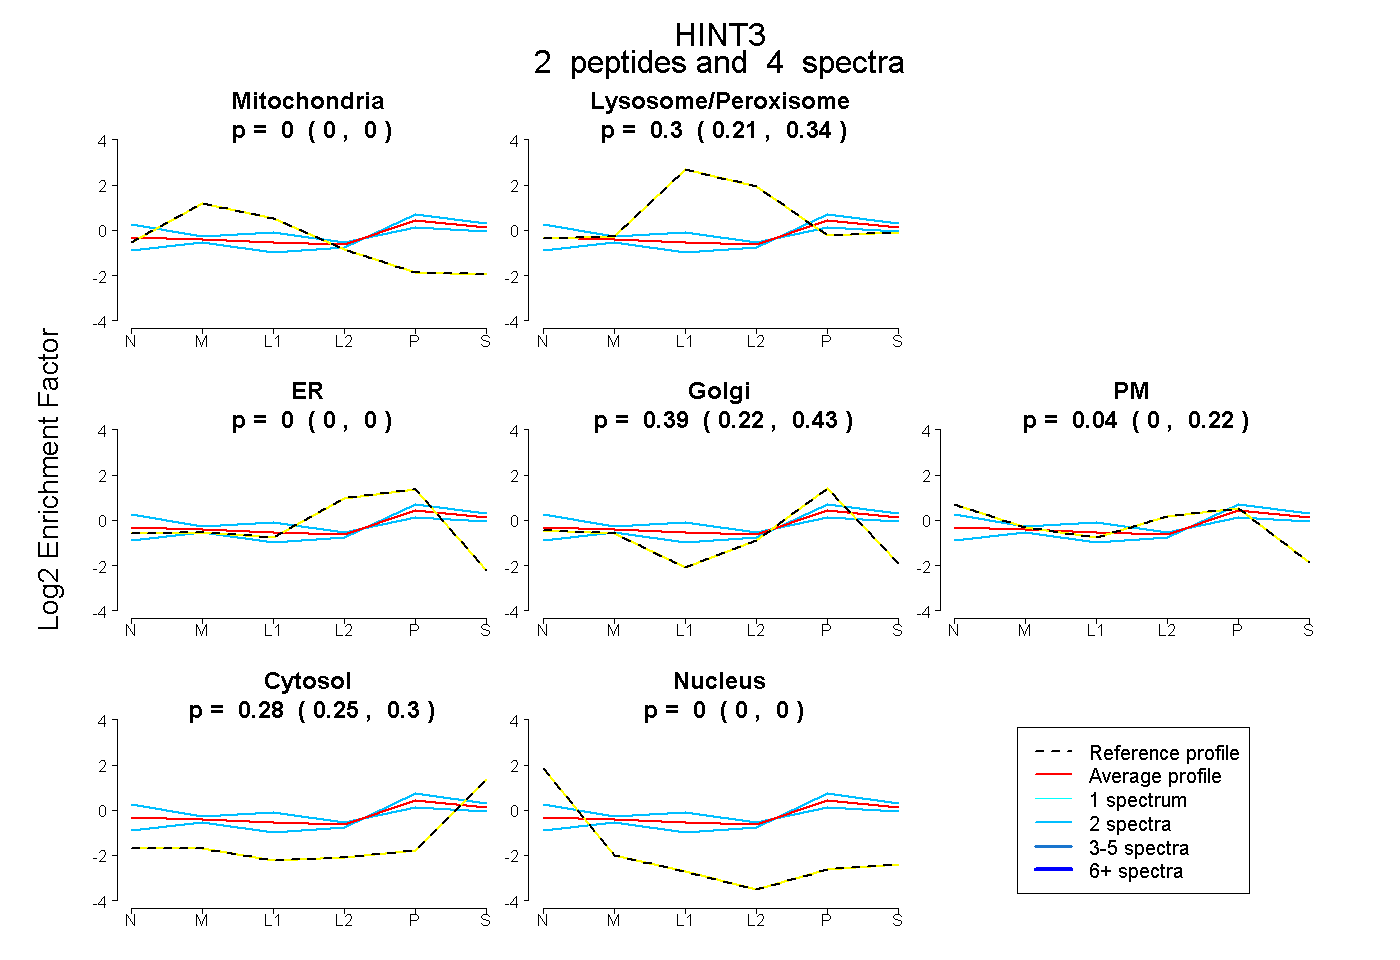 |
0.000 0.000 | 0.000 |
0.303 0.215 | 0.341 |
0.000 0.000 | 0.000 |
0.385 0.215 | 0.433 |
0.036 0.000 | 0.223 |
0.275 0.245 | 0.304 |
0.000 0.000 | 0.000 |
|||
| Plot | Lyso | Other | |||||||||||
| Expt C |
6 peptides |
17 spectra |
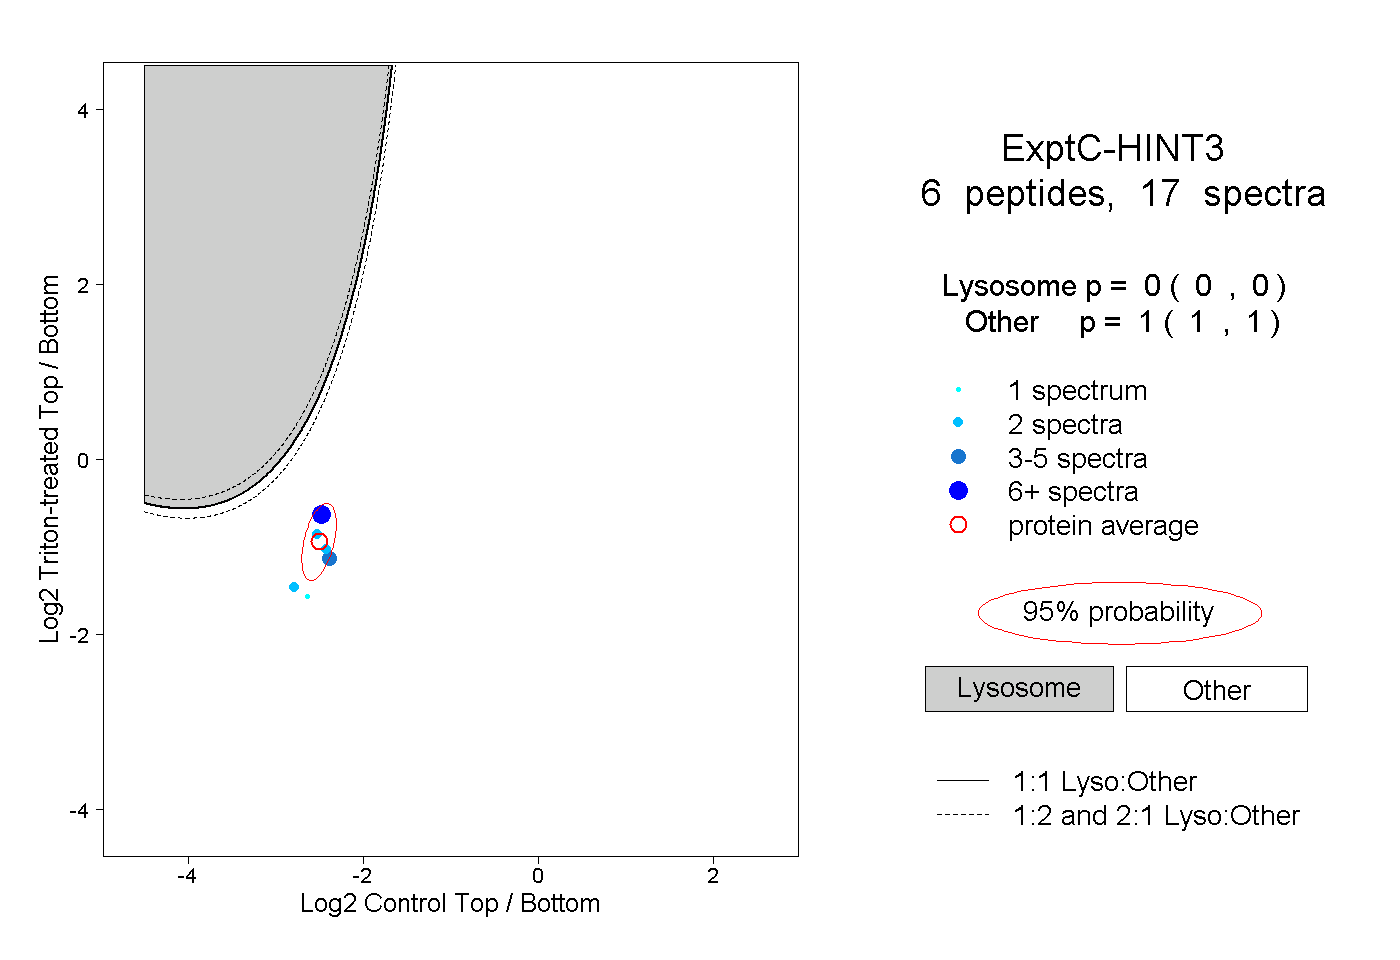 |
0.000 0.000 | 0.000 |
1.000 1.000 | 1.000 |
||||||||
| Plot | Lyso | Other | |||||||||||
| Expt D |
2 peptides |
3 spectra |
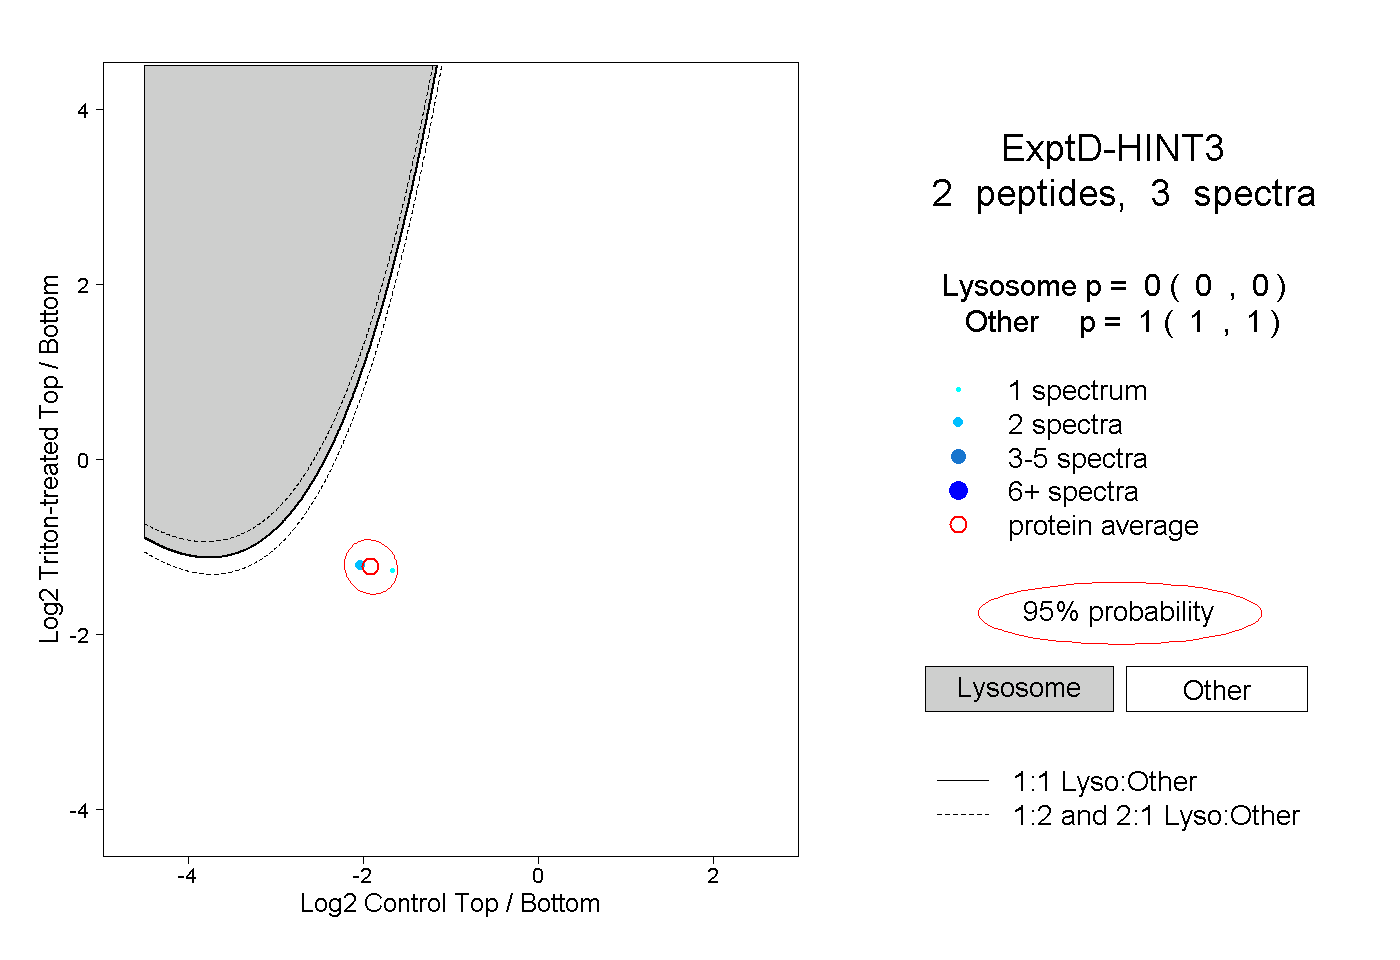 |
0.000 0.000 | 0.000 |
1.000 1.000 | 1.000 |