 7
7peptides
spectra
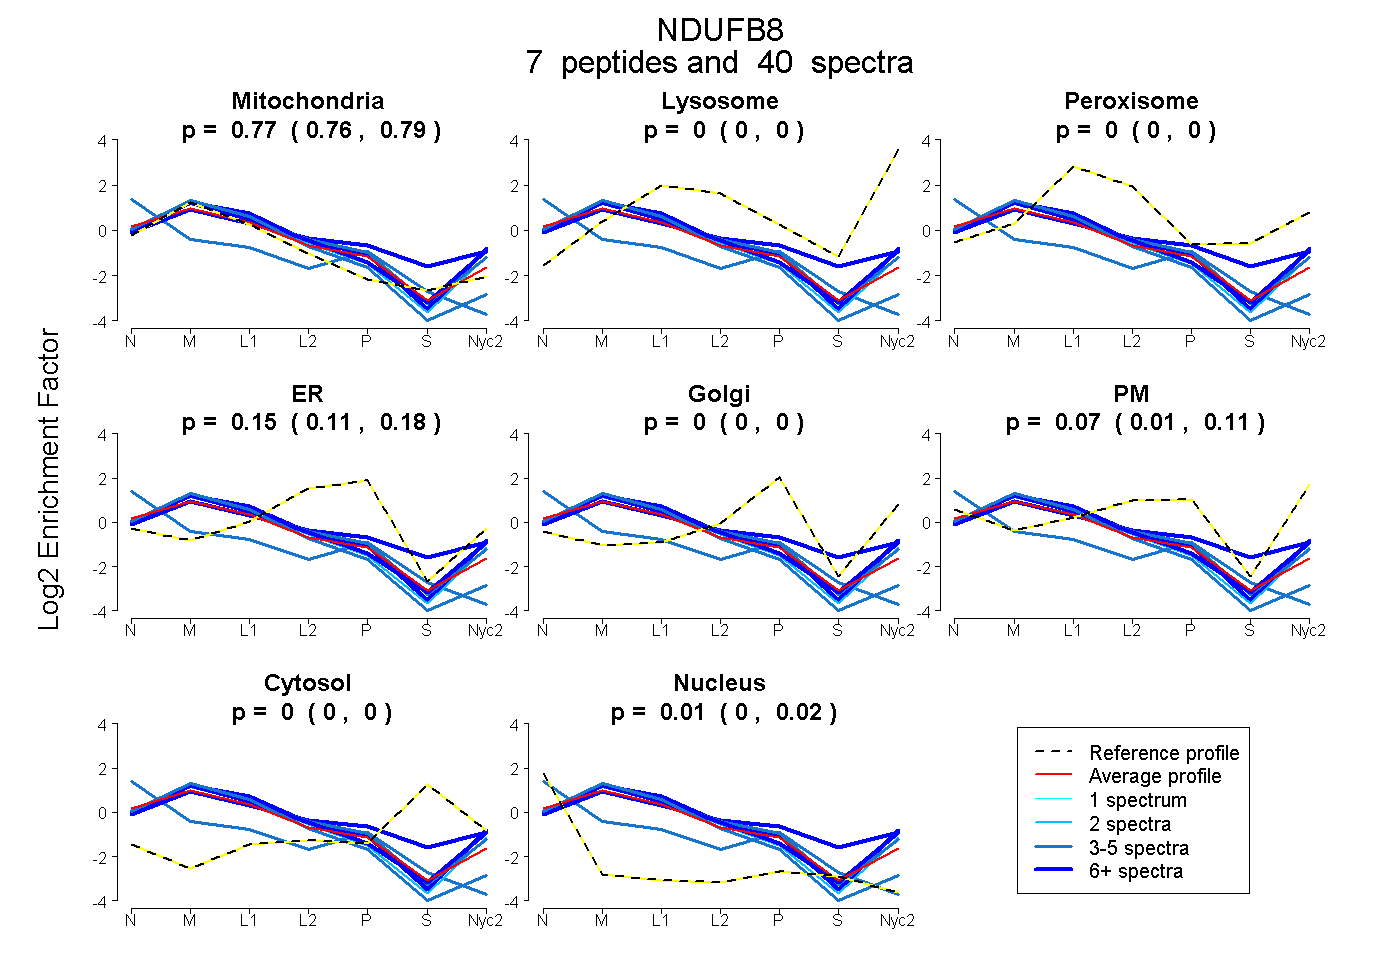
0.757 | 0.790
0.000 | 0.000
0.000 | 0.000
0.105 | 0.183
0.000 | 0.000
0.015 | 0.110
0.000 | 0.000
0.000 | 0.019
3peptides
spectra
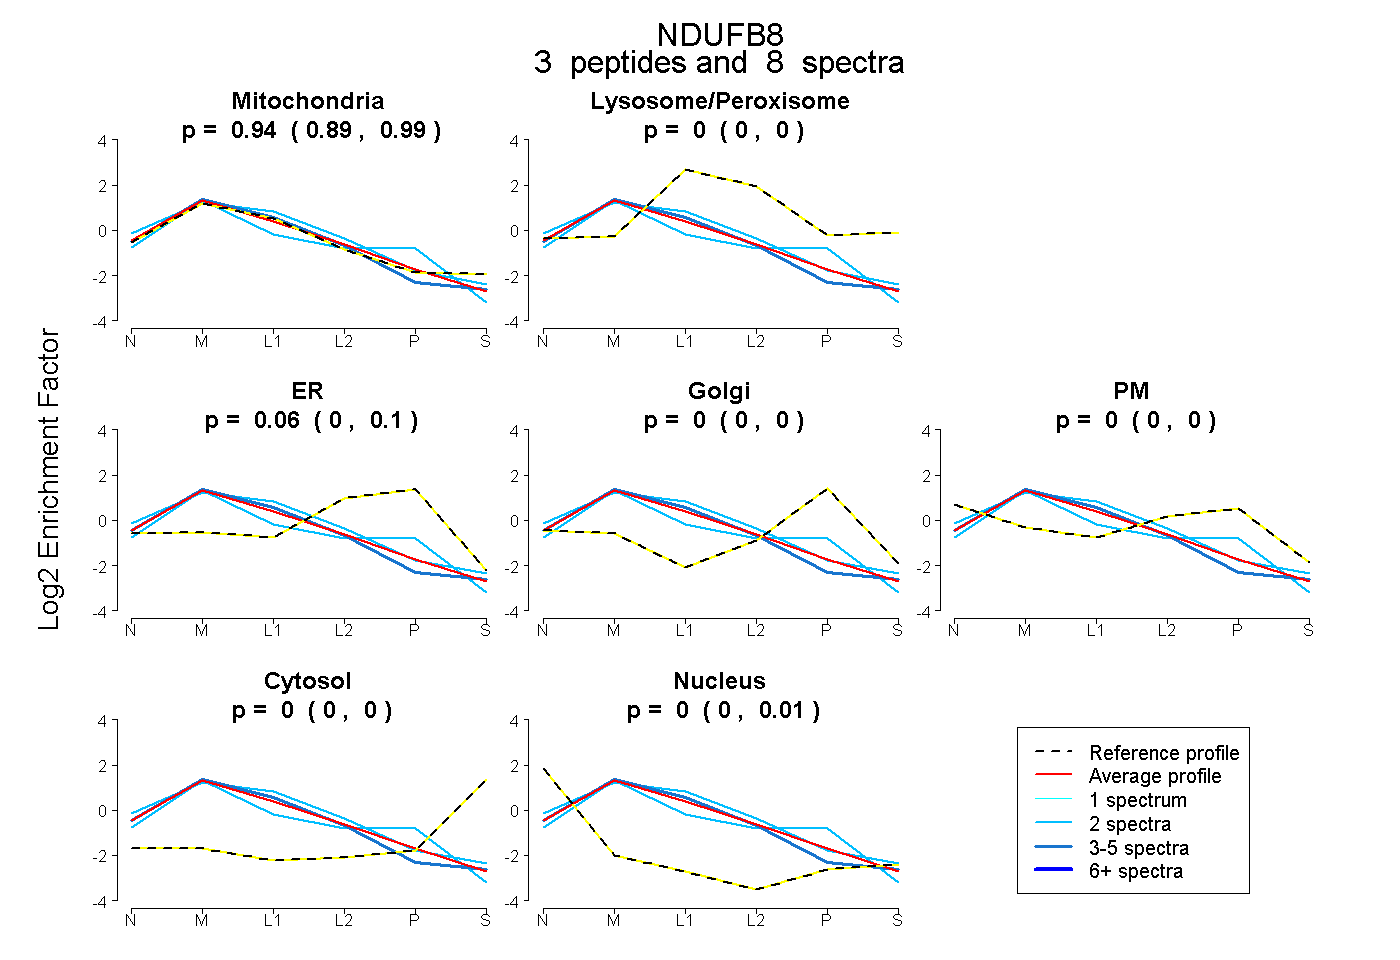
0.885 | 0.988
0.000 | 0.000
0.000 | 0.101
0.000 | 0.000
0.000 | 0.000
0.000 | 0.000
0.000 | 0.015
7peptides
spectra
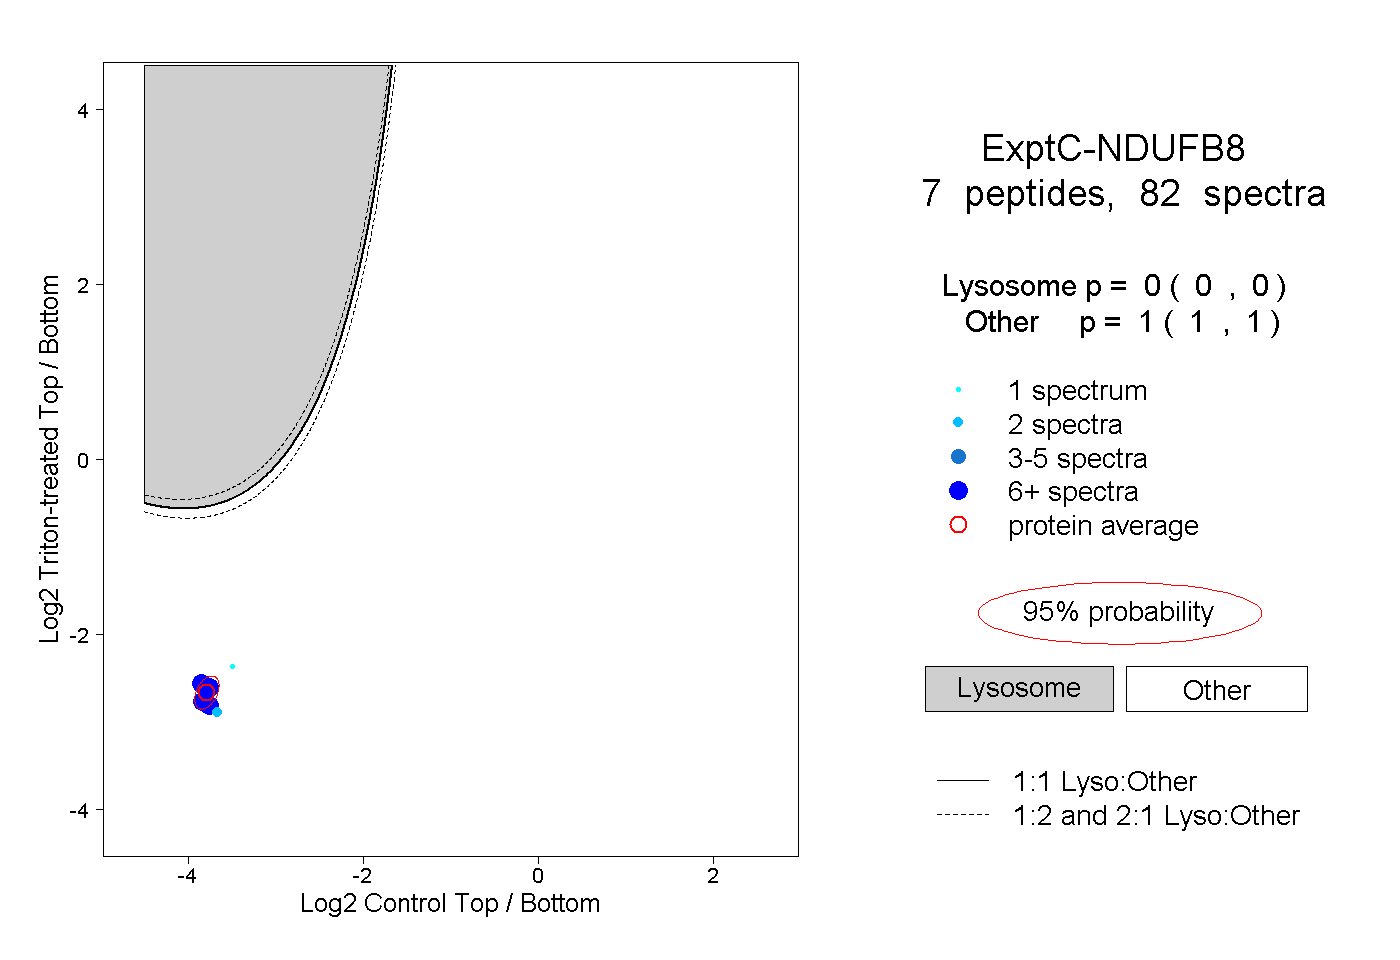
0.000 | 0.000
1.000 | 1.000
1peptide
spectrum
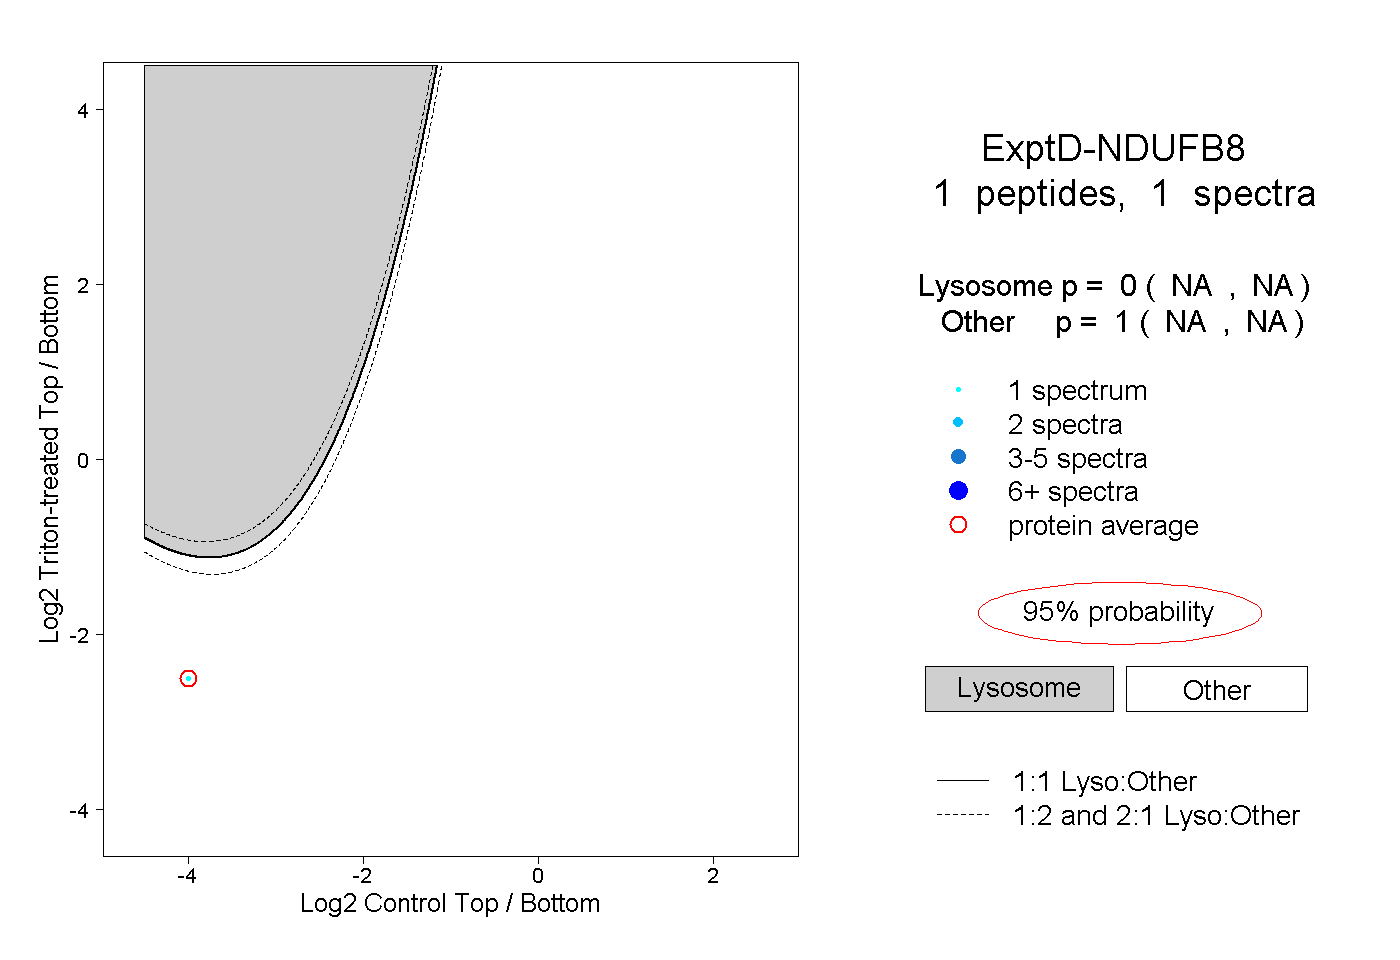
NA | NA
NA | NA