 7
7peptides
spectra
0.757 | 0.790
0.000 | 0.000
0.000 | 0.000
0.105 | 0.183
0.000 | 0.000
0.015 | 0.110
0.000 | 0.000
0.000 | 0.019
| Plot | Mito | Lyso | Perox | ER | Golgi | PM | Cytosol | Nucleus | |||||
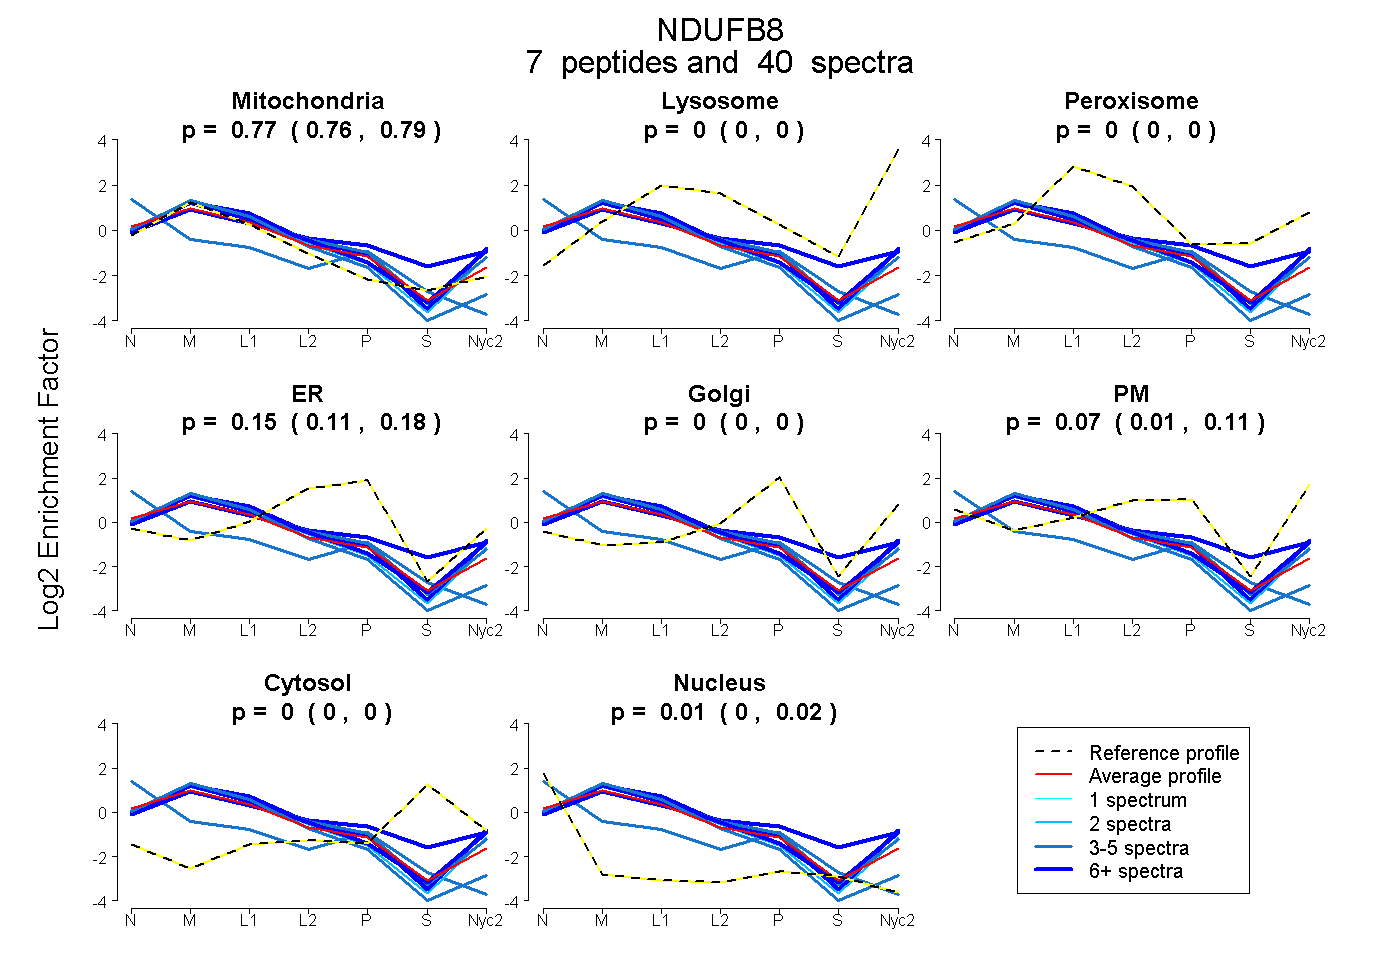
| Expt A |
7 peptides |
40 spectra |
|
0.775 0.757 | 0.790 |
0.000 0.000 | 0.000 |
0.000 0.000 | 0.000 |
0.147 0.105 | 0.183 |
0.000 0.000 | 0.000 |
0.068 0.015 | 0.110 |
0.000 0.000 | 0.000 |
0.010 0.000 | 0.019 |
| 9 spectra, QYPYNNLYLER | 0.752 | 0.033 | 0.000 | 0.000 | 0.000 | 0.214 | 0.000 | 0.000 | ||
| 7 spectra, DPWYEWDHPDLR | 0.556 | 0.000 | 0.193 | 0.000 | 0.213 | 0.000 | 0.038 | 0.000 | ||
| 5 spectra, AAAAK | 0.411 | 0.000 | 0.000 | 0.151 | 0.000 | 0.000 | 0.000 | 0.438 | ||
| 11 spectra, DMMPGSYPR | 0.706 | 0.013 | 0.000 | 0.000 | 0.000 | 0.281 | 0.000 | 0.000 | ||
| 3 spectra, VDTSPTPVSWDVMCR | 0.958 | 0.000 | 0.000 | 0.042 | 0.000 | 0.000 | 0.000 | 0.000 | ||
| 2 spectra, EPEPVVHYEI | 0.798 | 0.000 | 0.000 | 0.000 | 0.000 | 0.202 | 0.000 | 0.000 | ||
| 3 spectra, LNWGEPIHWDLDMYIR | 0.721 | 0.000 | 0.000 | 0.099 | 0.000 | 0.180 | 0.000 | 0.000 |
| Plot | Mito | Lyso or Perox | ER | Golgi | PM | Cytosol | Nucleus | ||||||
| Expt B |
3 peptides |
8 spectra |
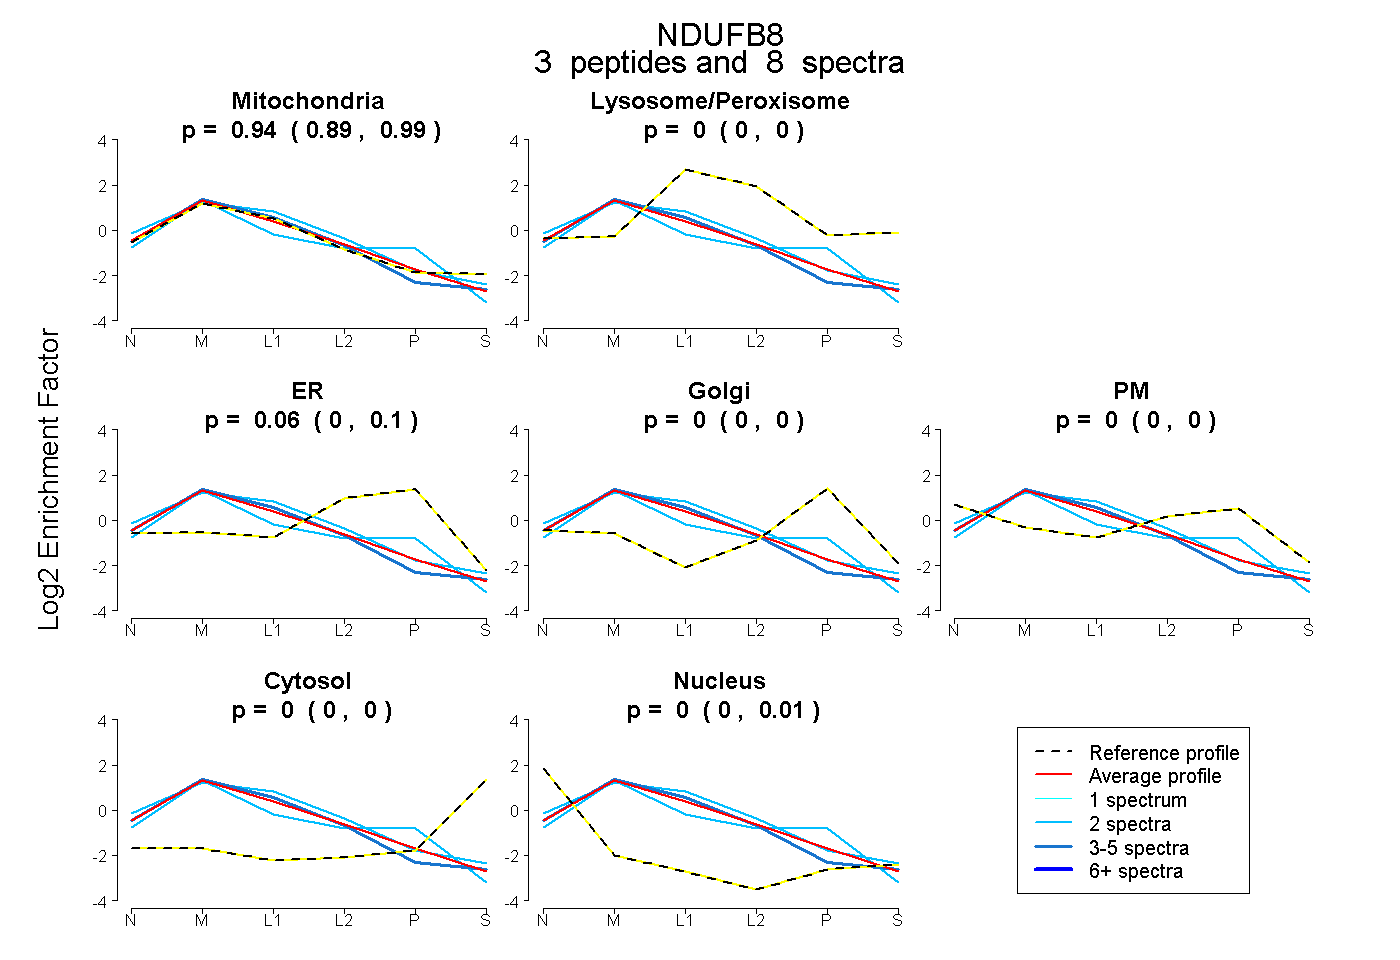 |
0.943 0.885 | 0.988 |
0.000 0.000 | 0.000 |
0.057 0.000 | 0.101 |
0.000 0.000 | 0.000 |
0.000 0.000 | 0.000 |
0.000 0.000 | 0.000 |
0.000 0.000 | 0.015 |
|||
| Plot | Lyso | Other | |||||||||||
| Expt C |
7 peptides |
82 spectra |
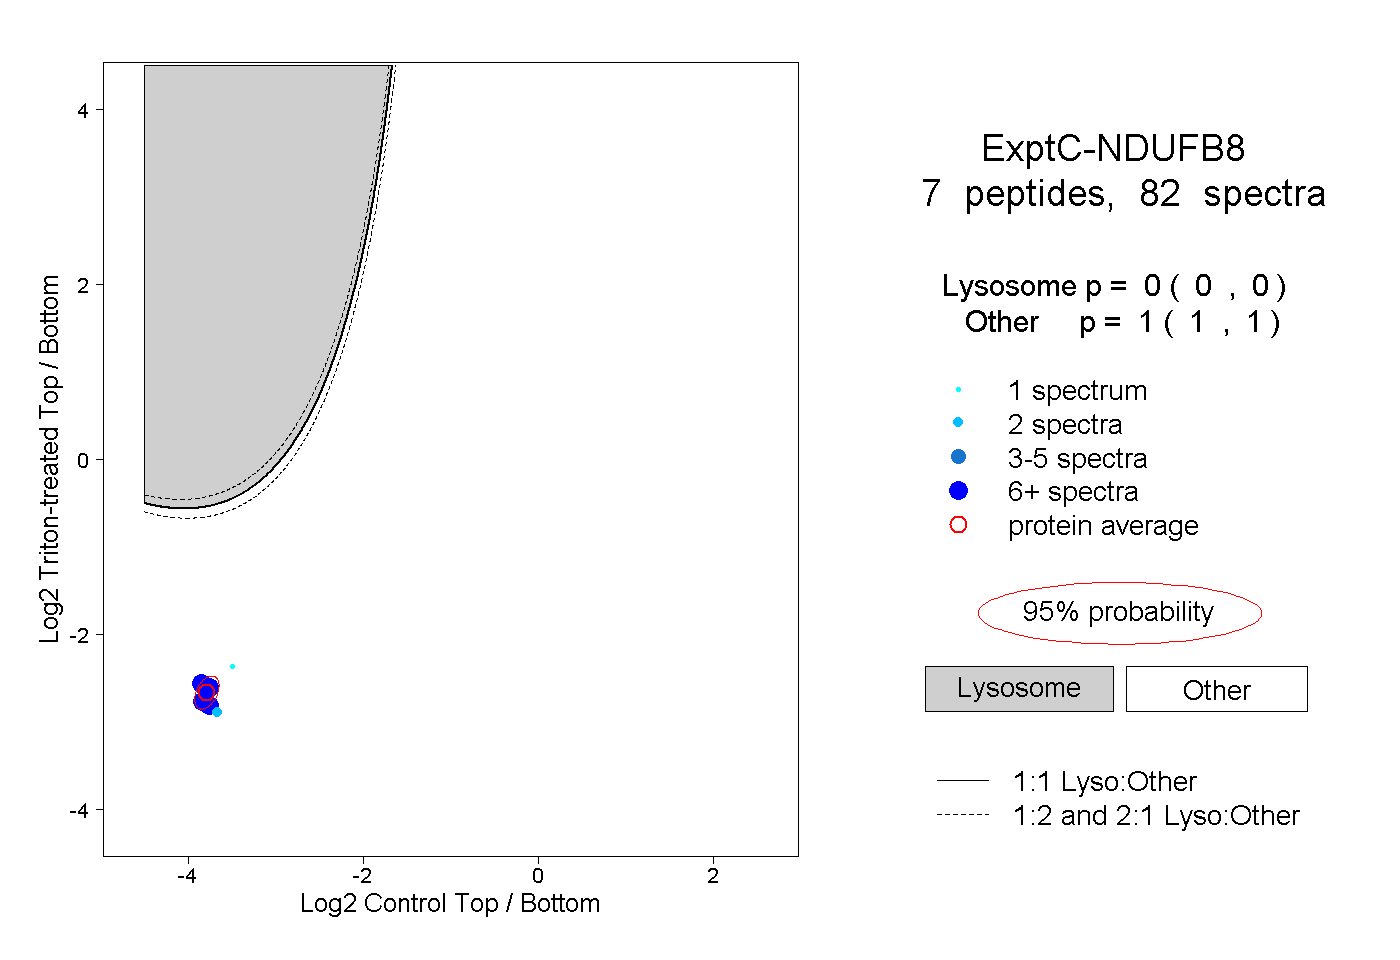 |
0.000 0.000 | 0.000 |
1.000 1.000 | 1.000 |
||||||||
| Plot | Lyso | Other | |||||||||||
| Expt D |
1 peptide |
1 spectrum |
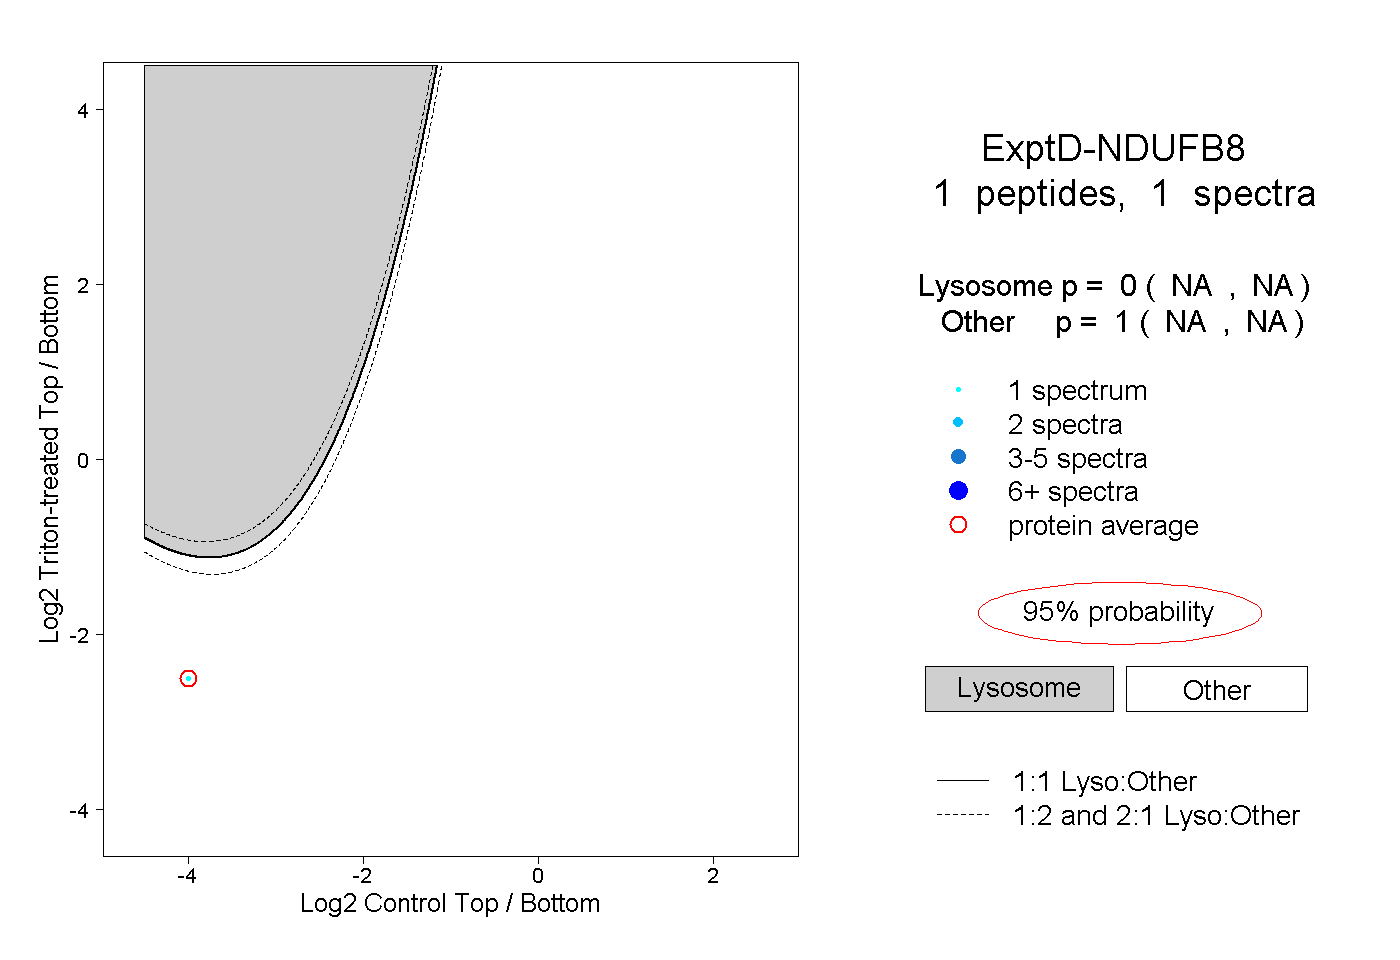 |
0.000 NA | NA |
1.000 NA | NA |