 9
9peptides
spectra
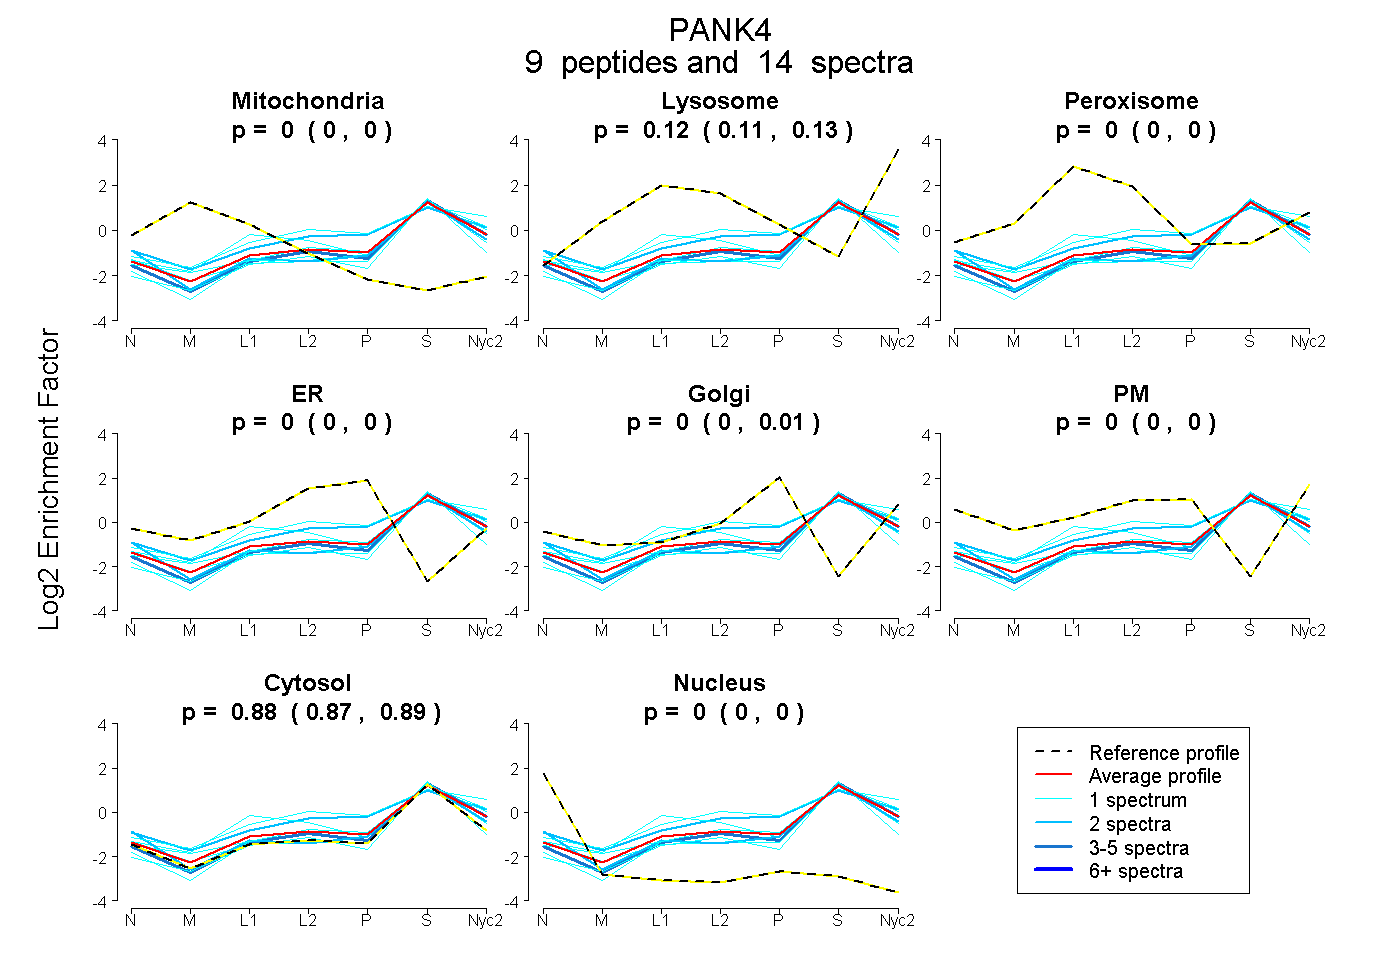
0.000 | 0.000
0.108 | 0.130
0.000 | 0.000
0.000 | 0.000
0.000 | 0.012
0.000 | 0.000
0.867 | 0.886
0.000 | 0.000
1peptide
spectrum
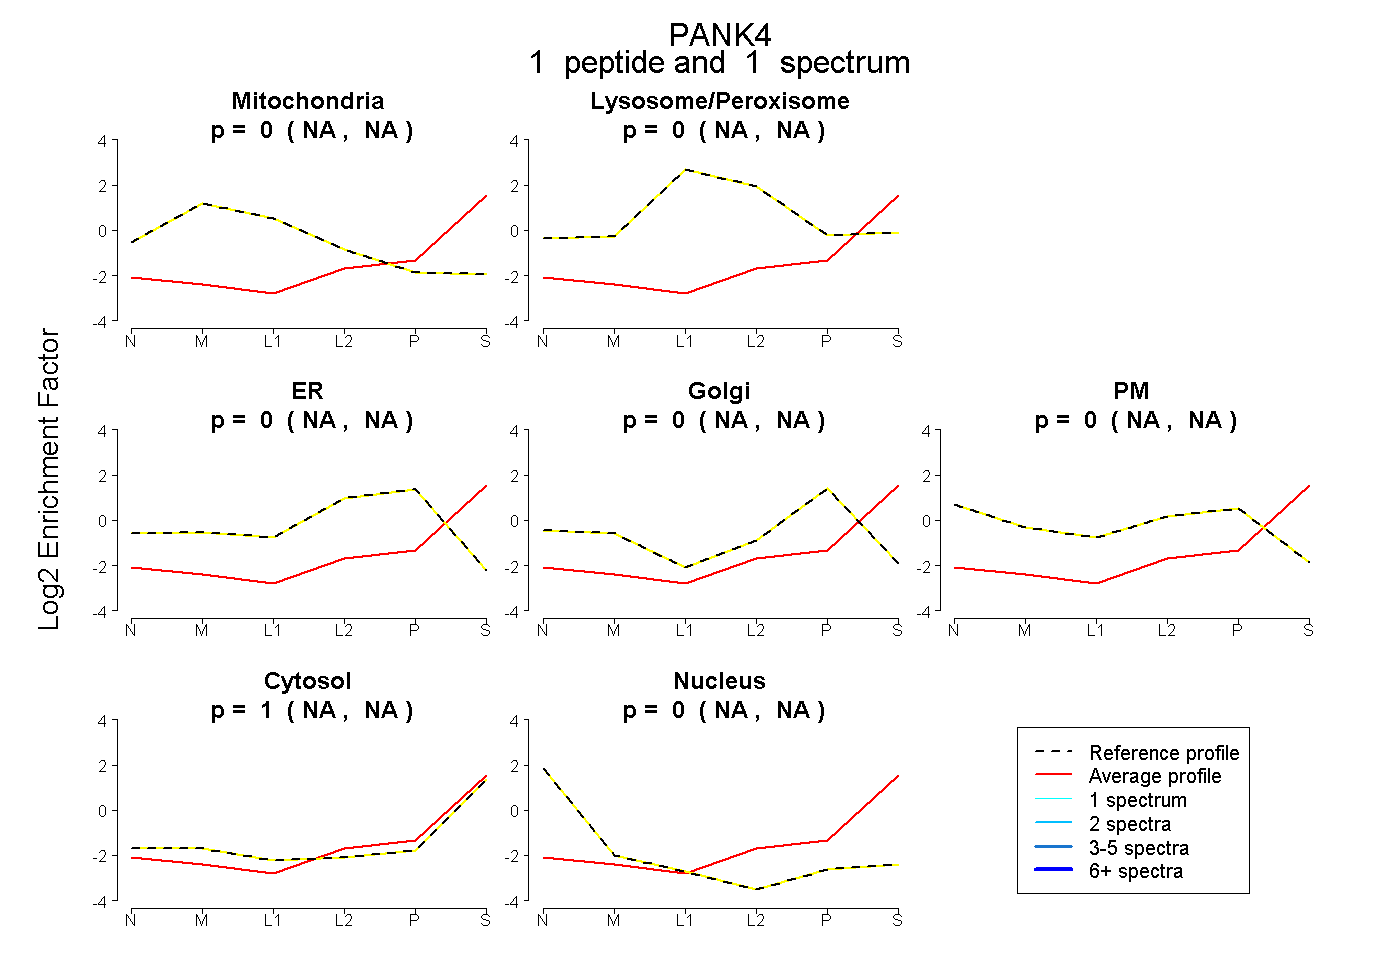
NA | NA
NA | NA
NA | NA
NA | NA
NA | NA
NA | NA
NA | NA
3peptides
spectra
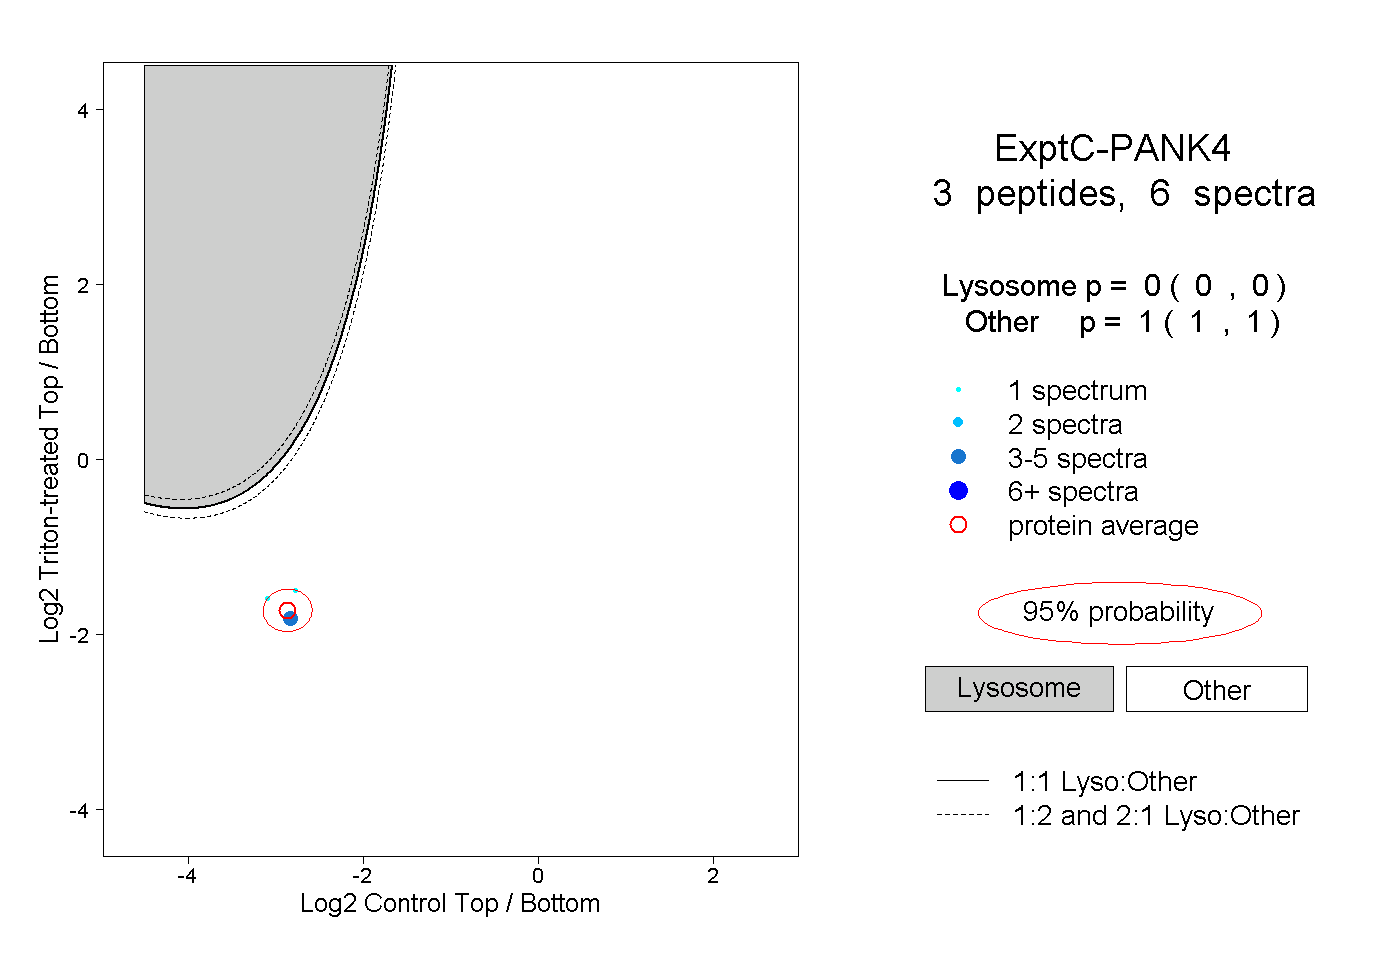
0.000 | 0.000
1.000 | 1.000
1peptide
spectrum
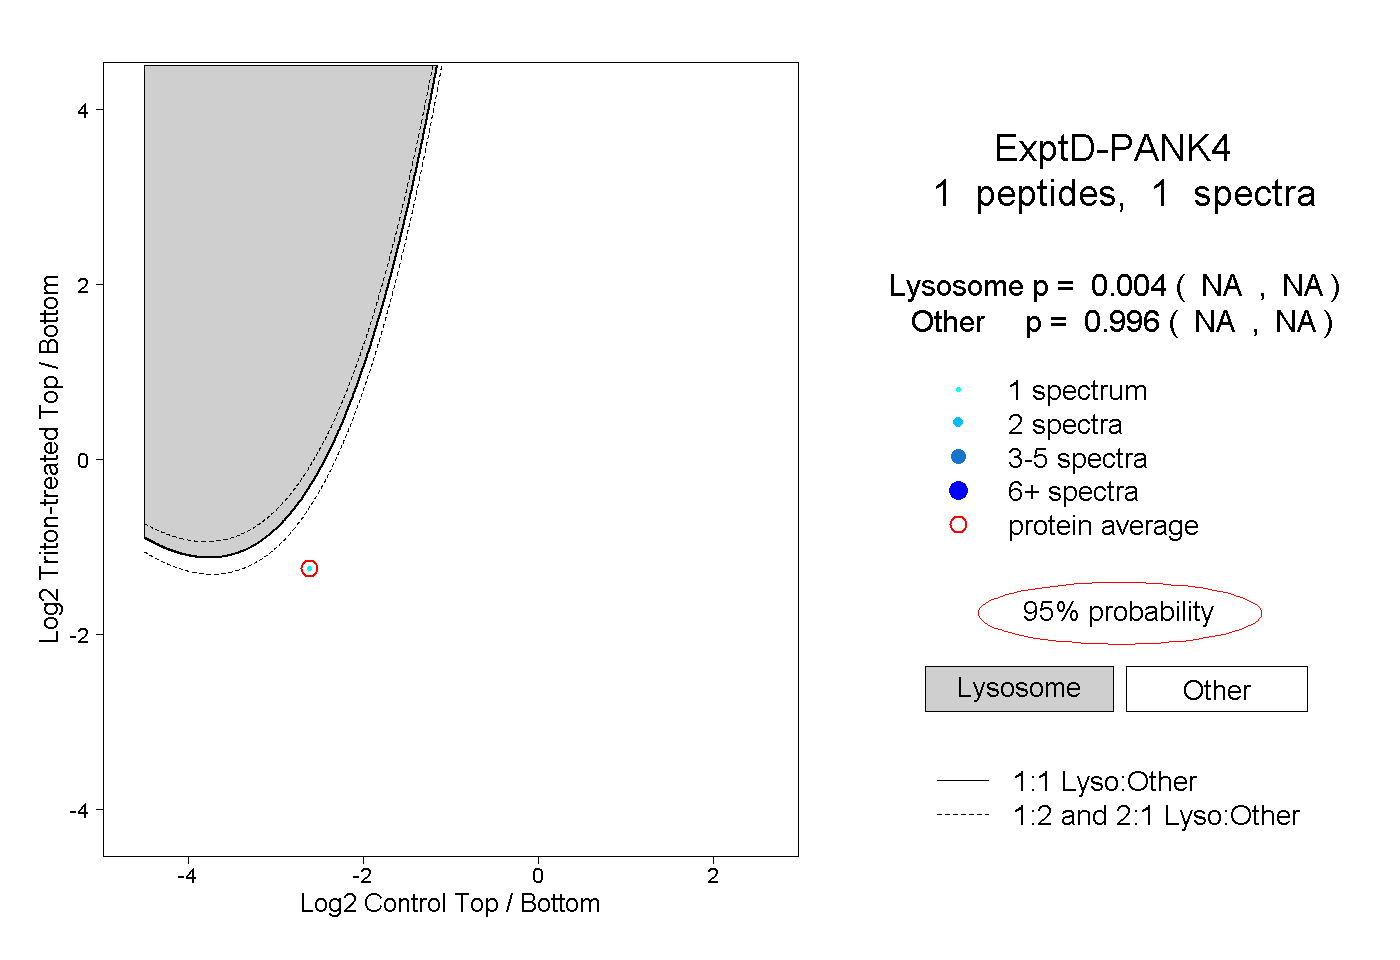
NA | NA
NA | NA