 9
9peptides
spectra
0.000 | 0.000
0.108 | 0.130
0.000 | 0.000
0.000 | 0.000
0.000 | 0.012
0.000 | 0.000
0.867 | 0.886
0.000 | 0.000
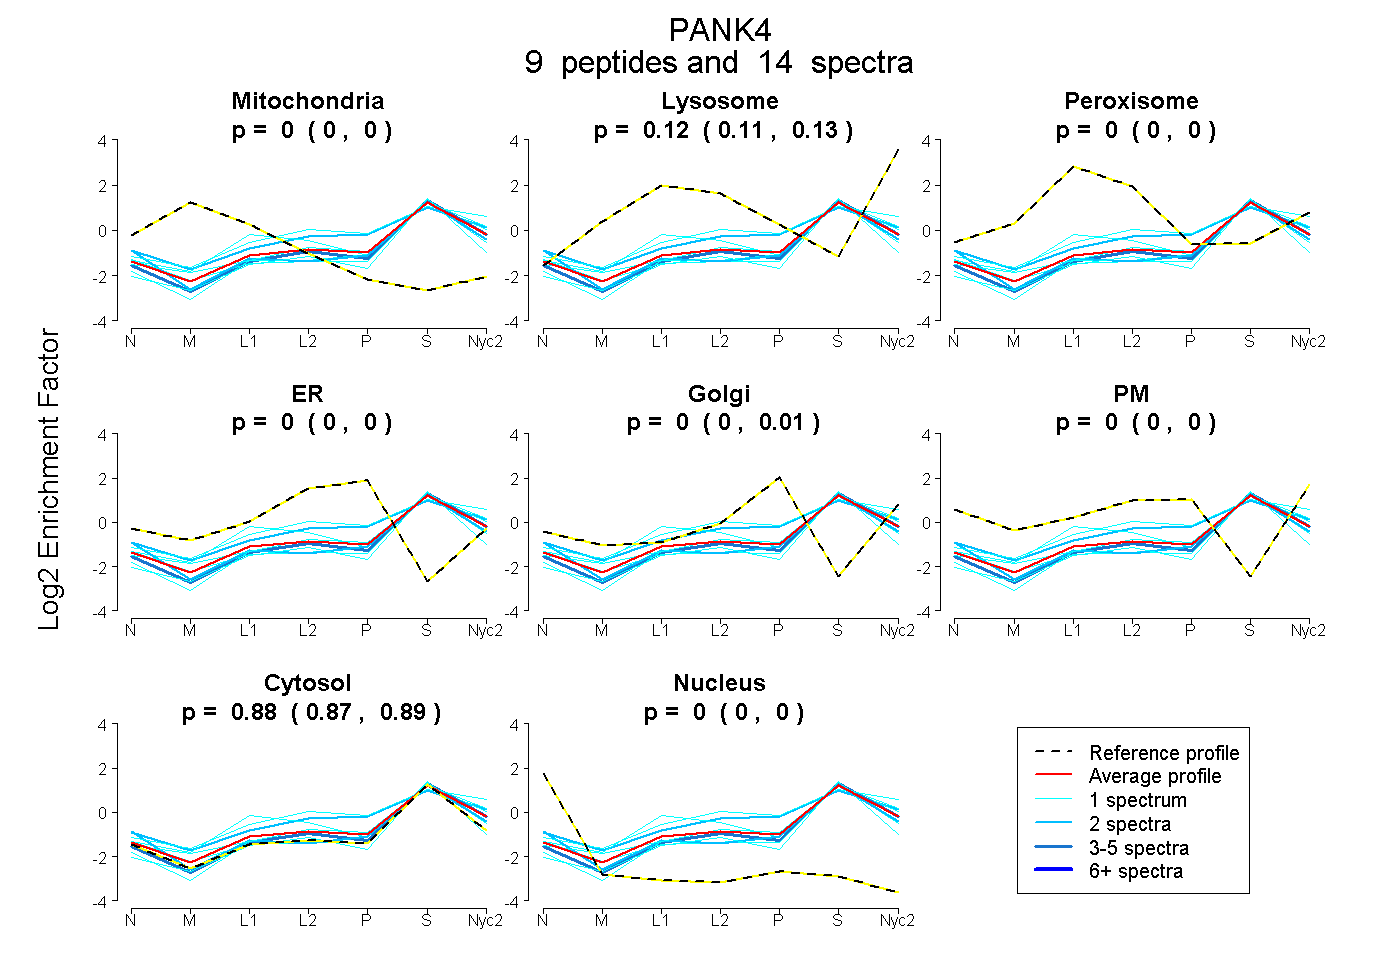
| Plot | Mito | Lyso | Perox | ER | Golgi | PM | Cytosol | Nucleus | |||||
| Expt A |
9 peptides |
14 spectra |
|
0.000 0.000 | 0.000 |
0.122 0.108 | 0.130 |
0.000 0.000 | 0.000 |
0.000 0.000 | 0.000 |
0.000 0.000 | 0.012 |
0.000 0.000 | 0.000 |
0.878 0.867 | 0.886 |
0.000 0.000 | 0.000 |
| 1 spectrum, LGGQLFSVIFK | 0.000 | 0.286 | 0.000 | 0.055 | 0.006 | 0.000 | 0.653 | 0.000 | ||
| 2 spectra, GLAVLVR | 0.000 | 0.000 | 0.000 | 0.000 | 0.000 | 0.069 | 0.931 | 0.000 | ||
| 4 spectra, DSDPEFR | 0.000 | 0.065 | 0.000 | 0.000 | 0.000 | 0.000 | 0.935 | 0.000 | ||
| 1 spectrum, AVSDVLESDPQFGFEEAK | 0.000 | 0.091 | 0.179 | 0.000 | 0.000 | 0.000 | 0.730 | 0.000 | ||
| 2 spectra, AVHTNYHALLR | 0.000 | 0.143 | 0.015 | 0.060 | 0.032 | 0.059 | 0.692 | 0.000 | ||
| 1 spectrum, LLLVQTGSSSPCLDLSR | 0.000 | 0.000 | 0.000 | 0.000 | 0.000 | 0.000 | 1.000 | 0.000 | ||
| 1 spectrum, GEVQALFLR | 0.007 | 0.033 | 0.000 | 0.000 | 0.000 | 0.000 | 0.960 | 0.000 | ||
| 1 spectrum, GADLVVIEGMGR | 0.000 | 0.015 | 0.000 | 0.000 | 0.000 | 0.000 | 0.985 | 0.000 | ||
| 1 spectrum, LHGLDR | 0.000 | 0.163 | 0.000 | 0.000 | 0.000 | 0.000 | 0.837 | 0.000 |
| Plot | Mito | Lyso or Perox | ER | Golgi | PM | Cytosol | Nucleus | ||||||
| Expt B |
1 peptide |
1 spectrum |
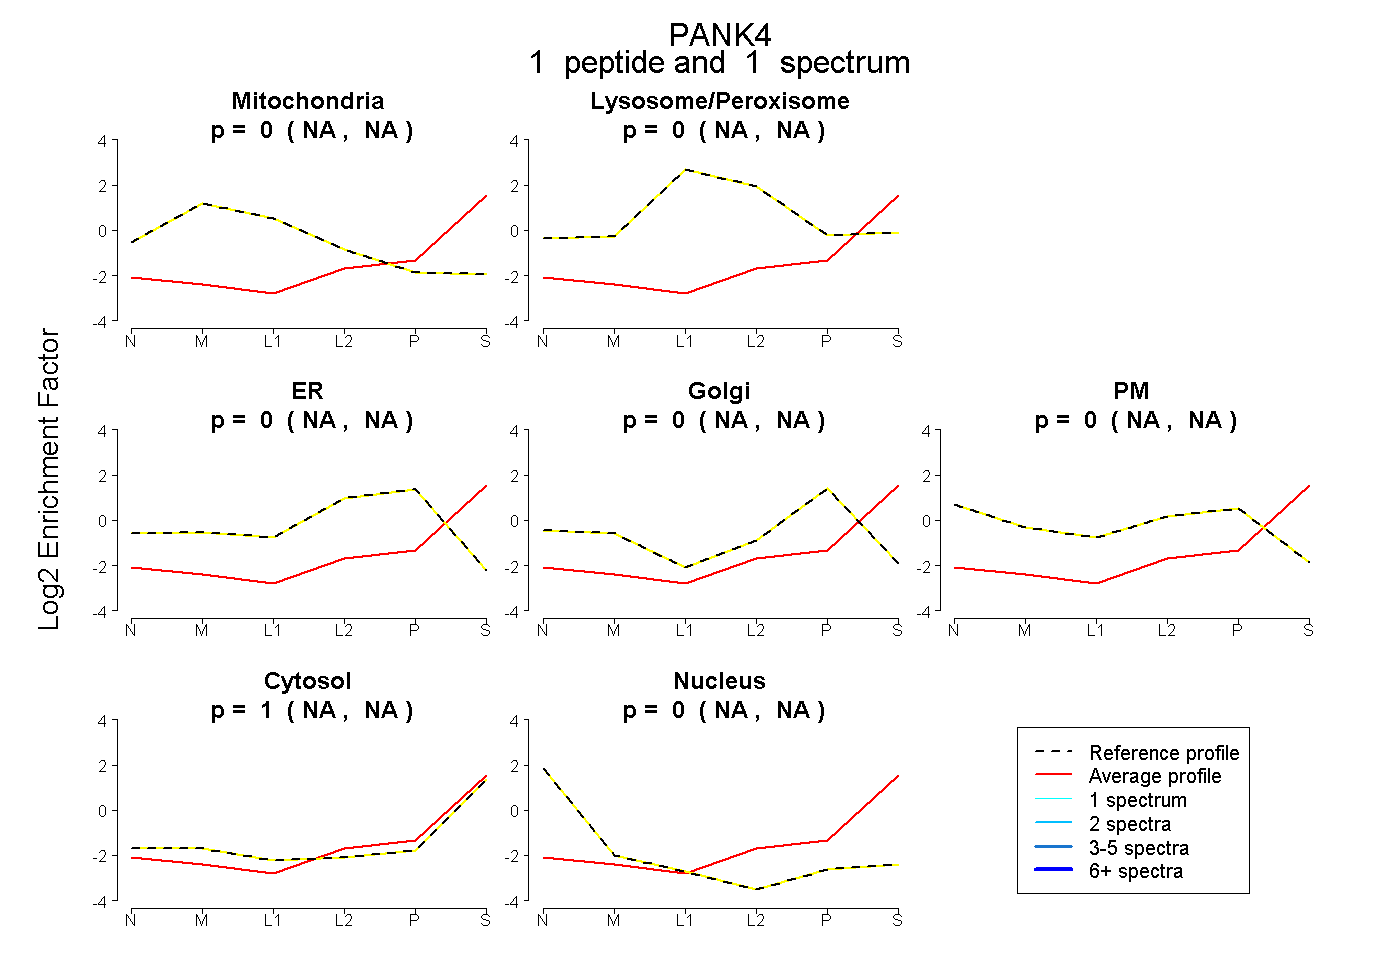 |
0.000 NA | NA |
0.000 NA | NA |
0.000 NA | NA |
0.003 NA | NA |
0.000 NA | NA |
0.997 NA | NA |
0.000 NA | NA |
|||
| Plot | Lyso | Other | |||||||||||
| Expt C |
3 peptides |
6 spectra |
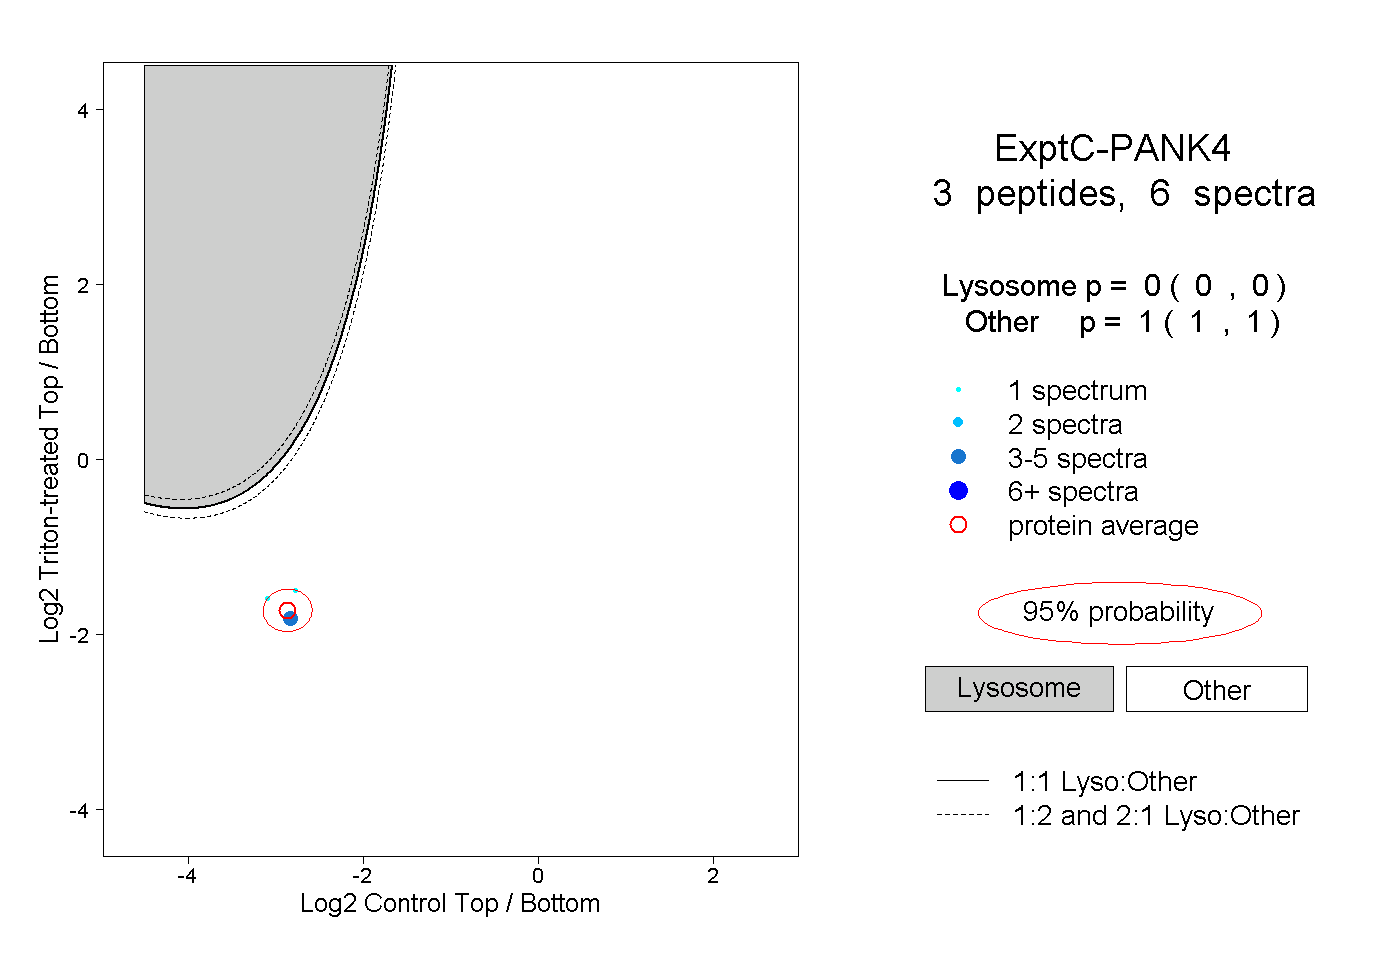 |
0.000 0.000 | 0.000 |
1.000 1.000 | 1.000 |
||||||||
| Plot | Lyso | Other | |||||||||||
| Expt D |
1 peptide |
1 spectrum |
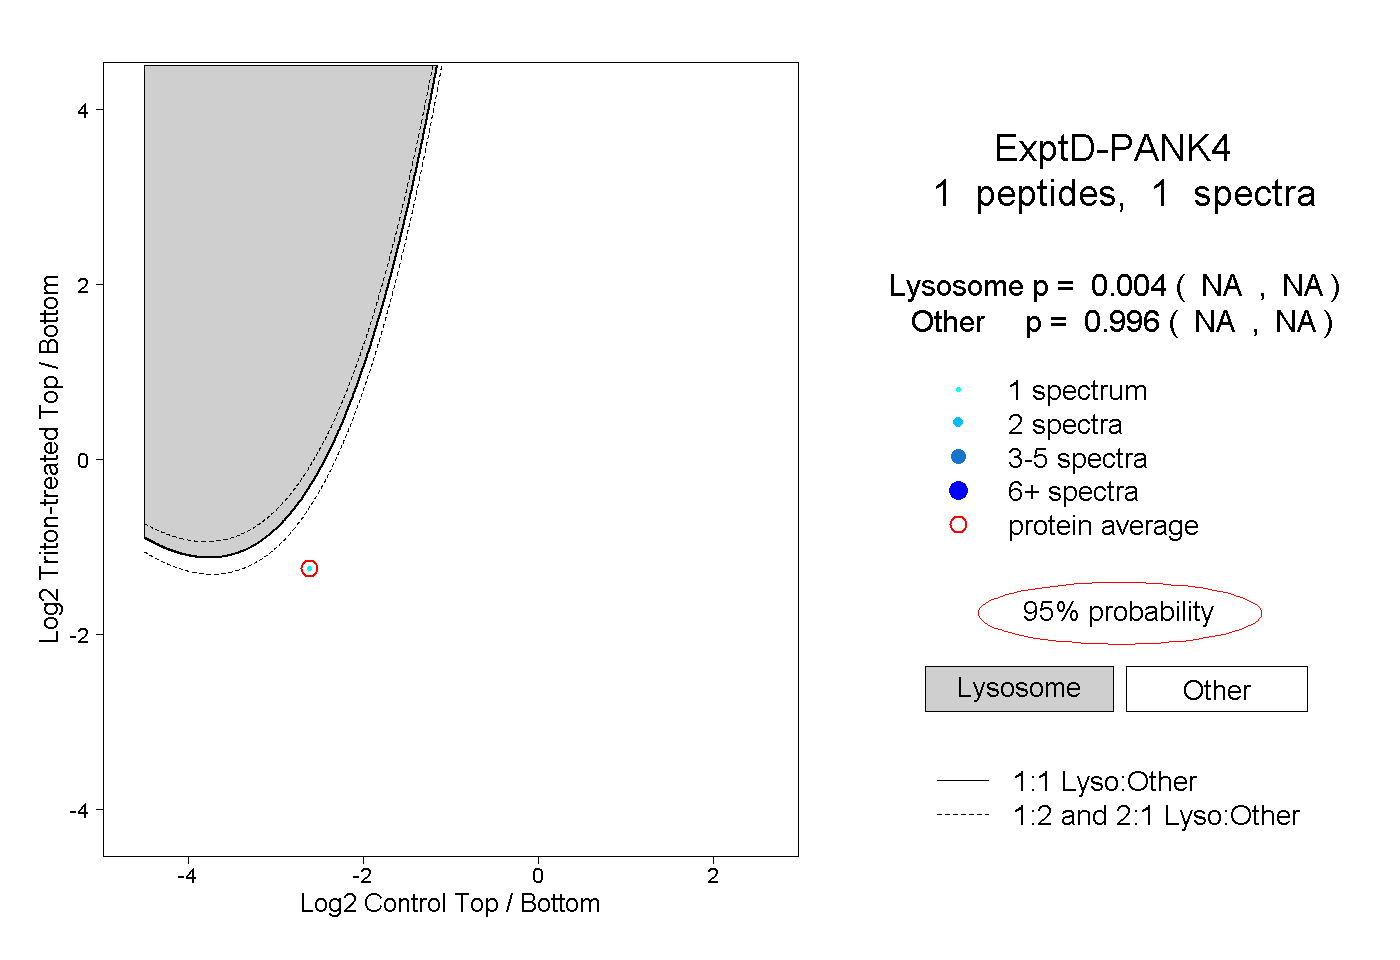 |
0.004 NA | NA |
0.996 NA | NA |