 2
2peptides
spectra
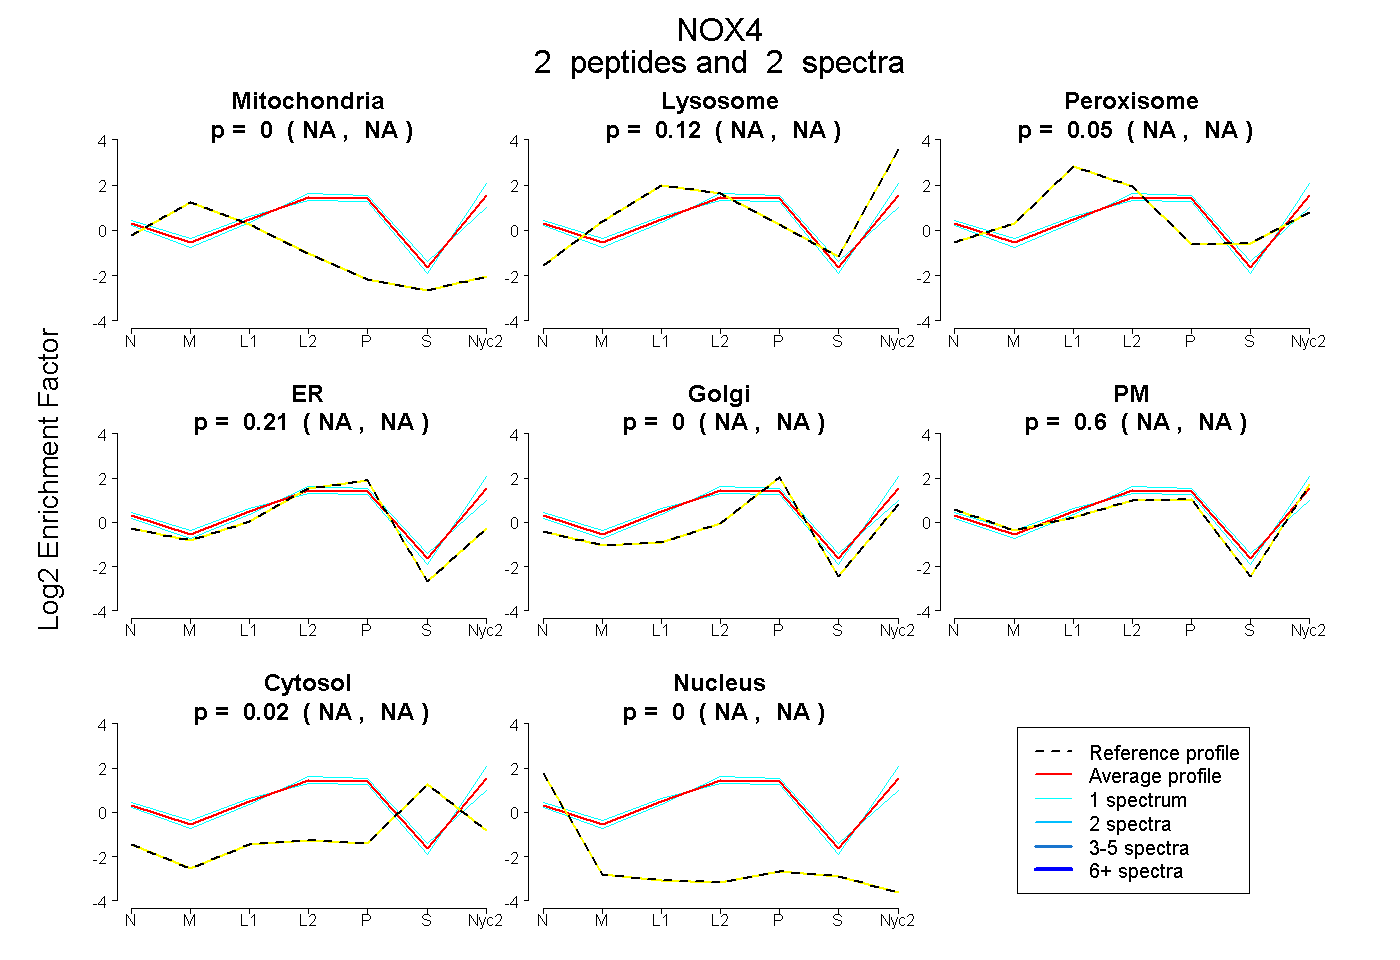
NA | NA
NA | NA
NA | NA
NA | NA
NA | NA
NA | NA
NA | NA
NA | NA
2peptides
spectra
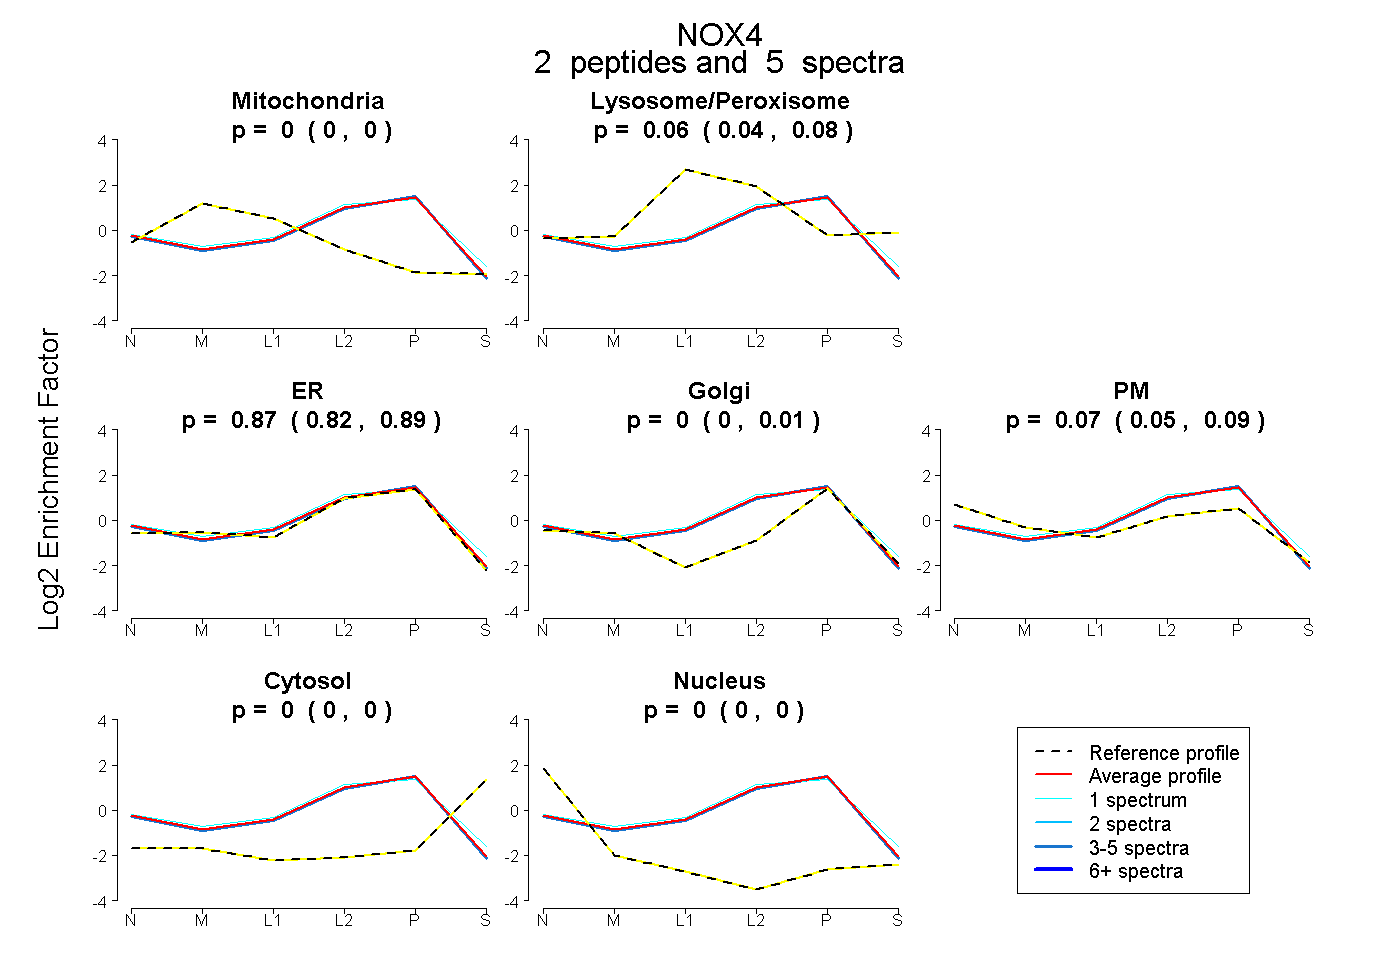
0.000 | 0.000
0.042 | 0.085
0.817 | 0.893
0.000 | 0.013
0.047 | 0.090
0.000 | 0.000
0.000 | 0.000
2peptides
spectra
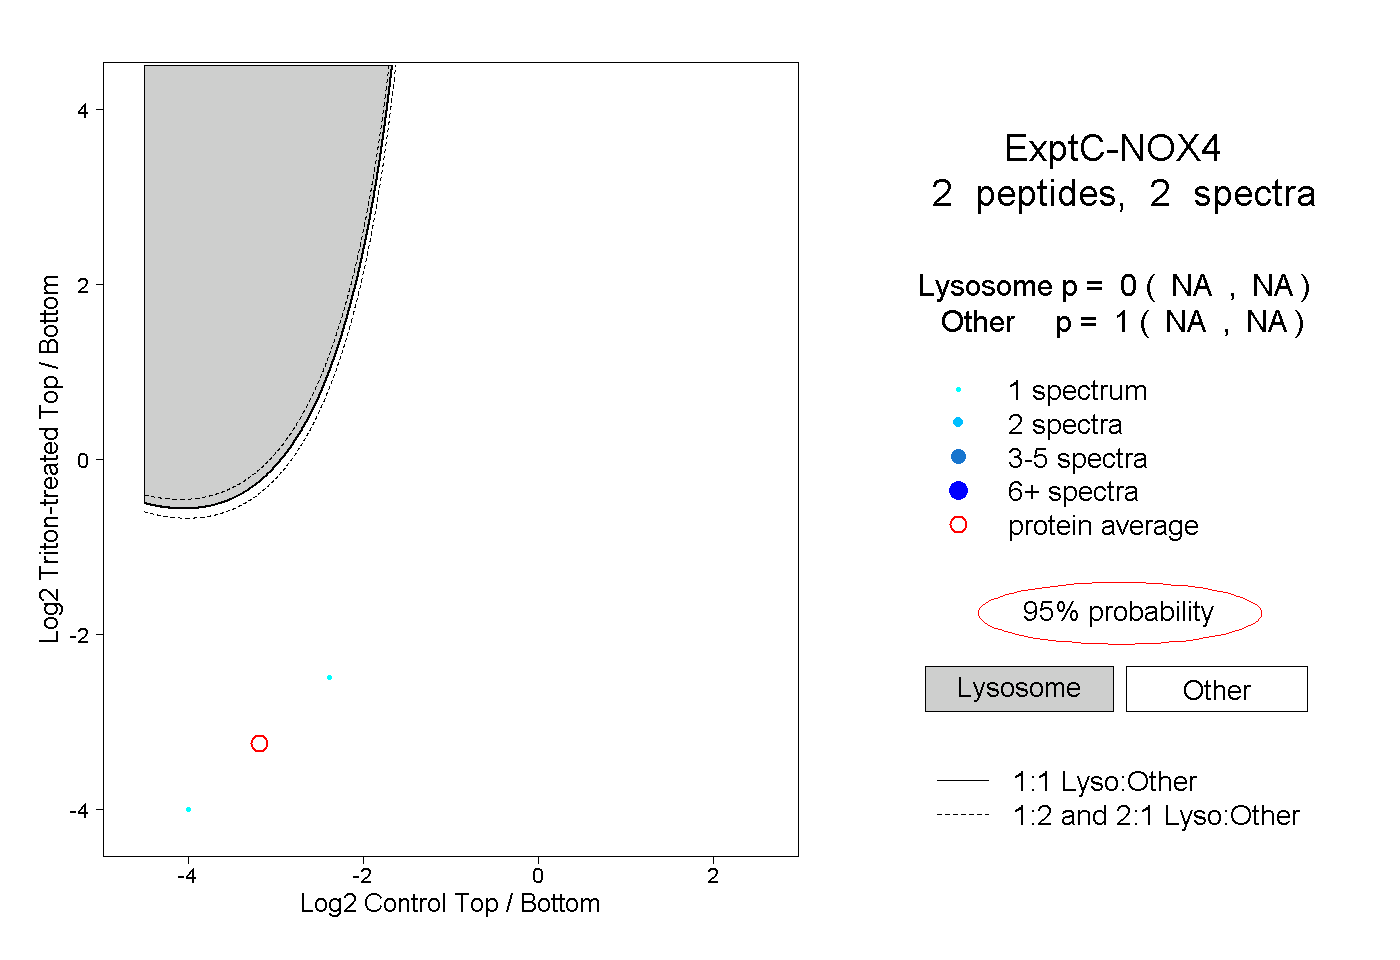
NA | NA
NA | NA