 2
2peptides
spectra
NA | NA
NA | NA
NA | NA
NA | NA
NA | NA
NA | NA
NA | NA
NA | NA
| Plot | Mito | Lyso | Perox | ER | Golgi | PM | Cytosol | Nucleus | |||||
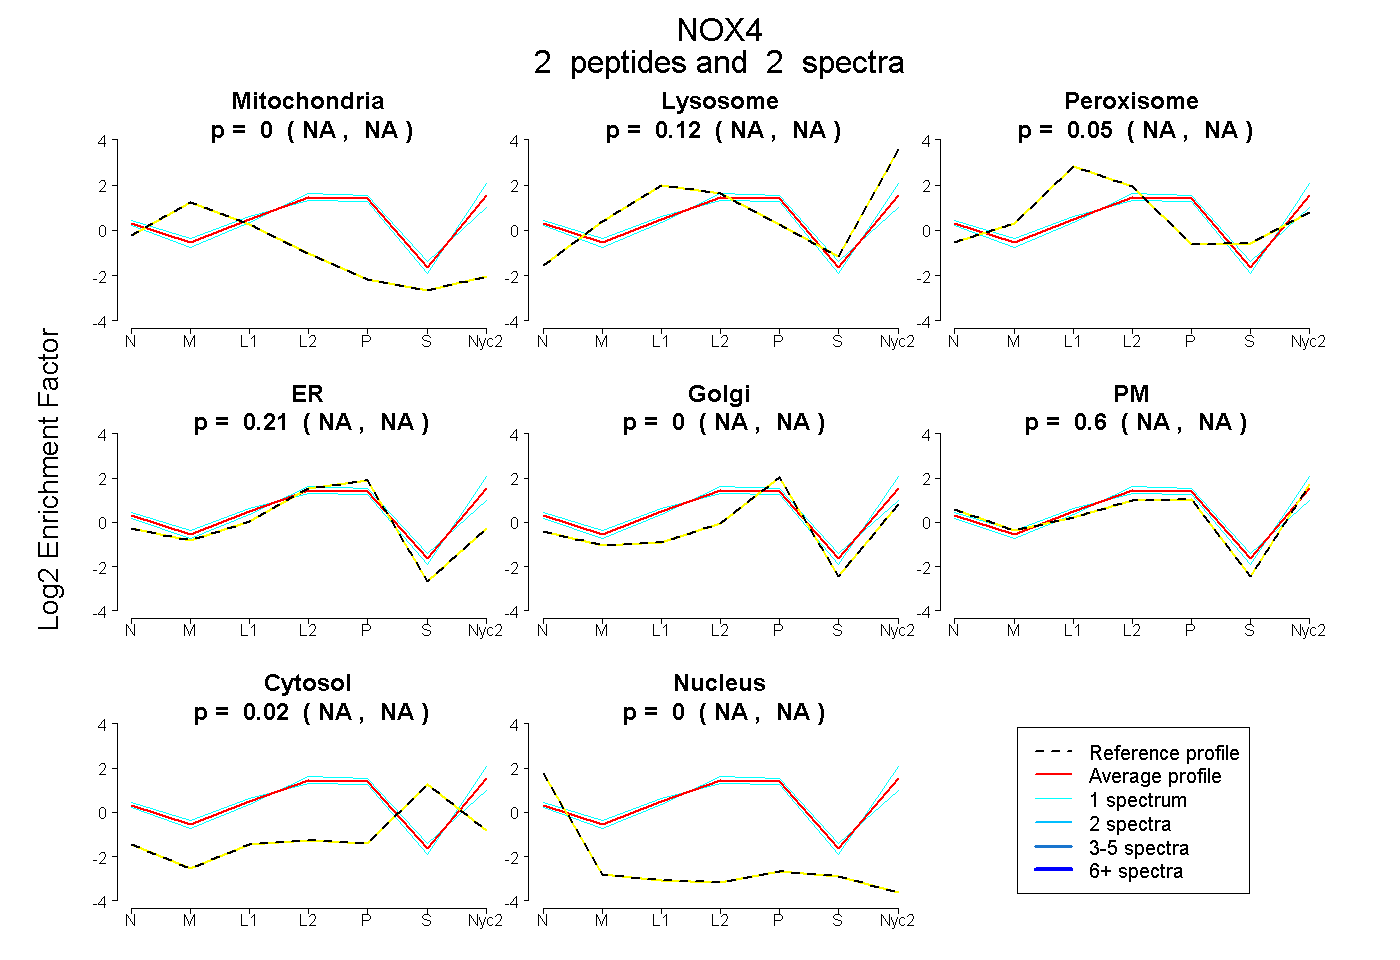
| Expt A |
2 peptides |
2 spectra |
|
0.000 NA | NA |
0.123 NA | NA |
0.053 NA | NA |
0.208 NA | NA |
0.000 NA | NA |
0.600 NA | NA |
0.017 NA | NA |
0.000 NA | NA |
| 1 spectrum, ALSWR | 0.000 | 0.168 | 0.008 | 0.011 | 0.000 | 0.814 | 0.000 | 0.000 | ||
| 1 spectrum, LFIGRPR | 0.000 | 0.087 | 0.084 | 0.398 | 0.000 | 0.378 | 0.053 | 0.000 |
| Plot | Mito | Lyso or Perox | ER | Golgi | PM | Cytosol | Nucleus | ||||||
| Expt B |
2 peptides |
5 spectra |
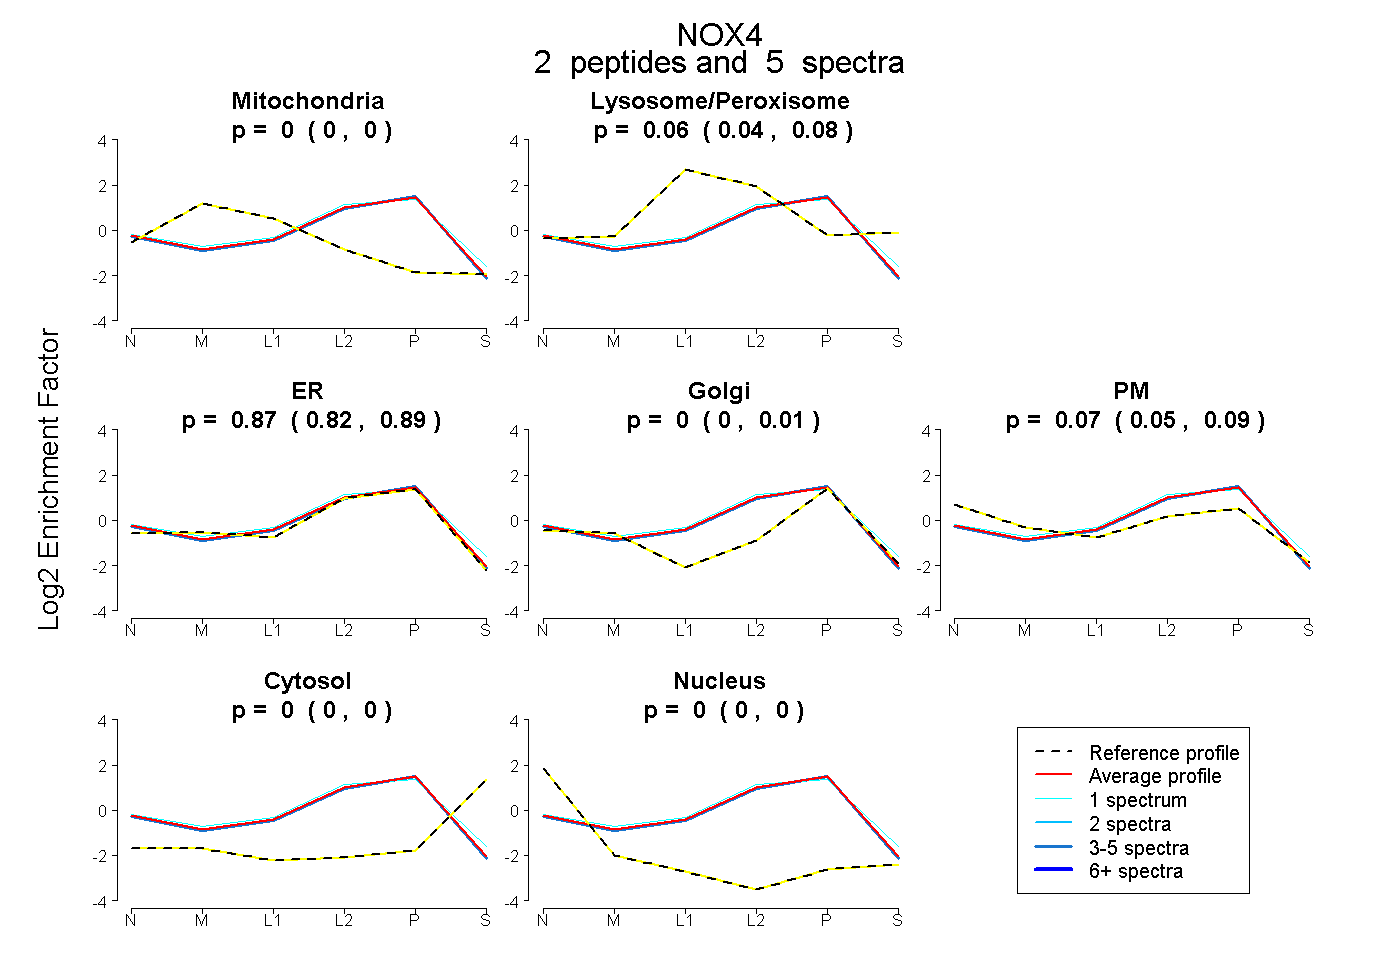 |
0.000 0.000 | 0.000 |
0.063 0.042 | 0.085 |
0.865 0.817 | 0.893 |
0.000 0.000 | 0.013 |
0.072 0.047 | 0.090 |
0.000 0.000 | 0.000 |
0.000 0.000 | 0.000 |
|||
| Plot | Lyso | Other | |||||||||||
| Expt C |
2 peptides |
2 spectra |
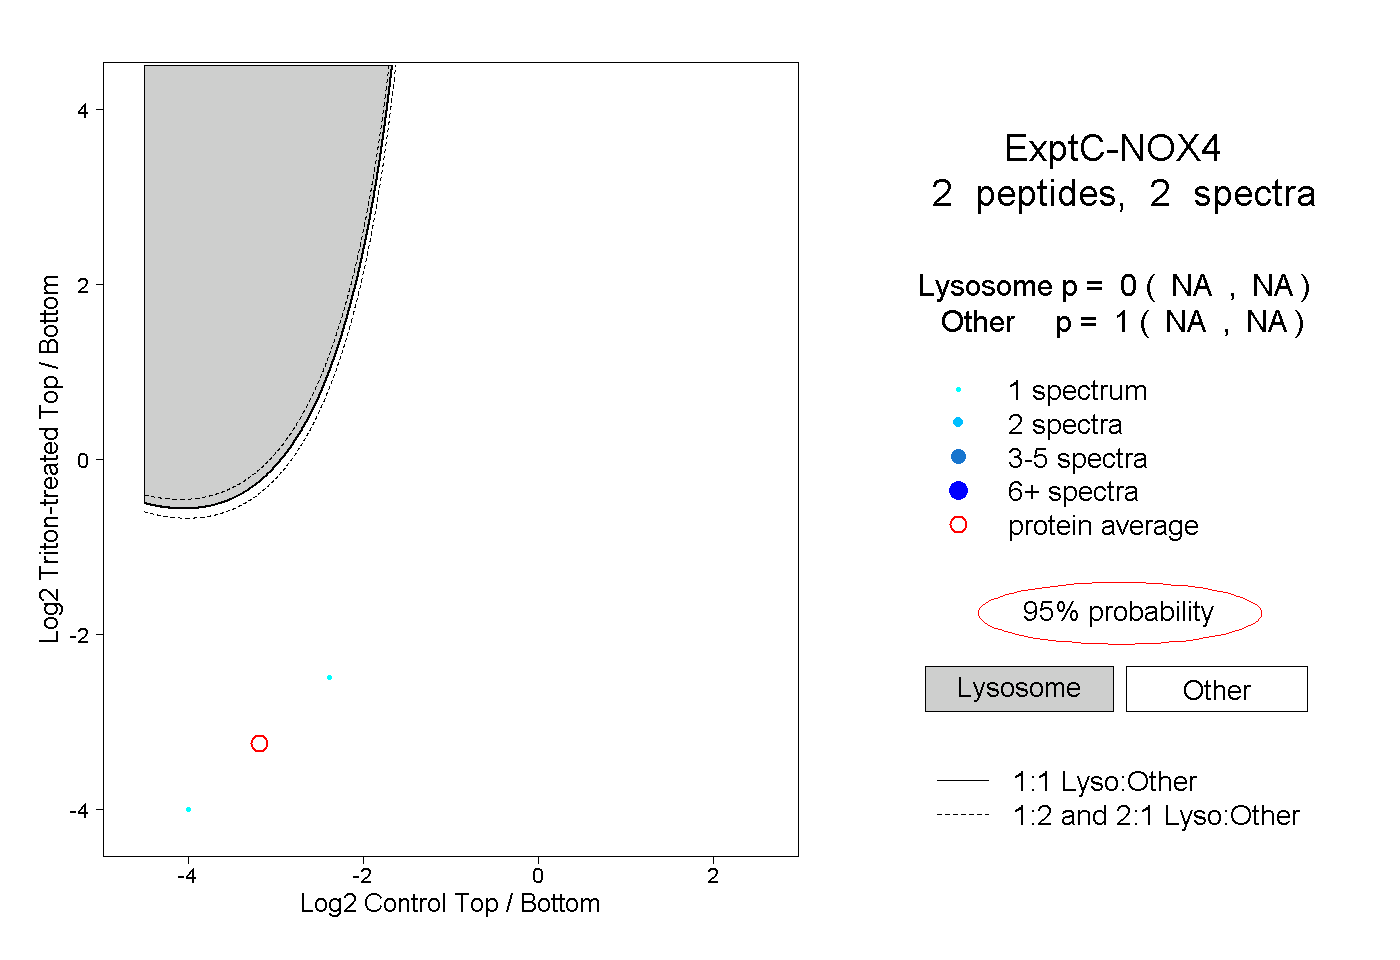 |
0.000 NA | NA |
1.000 NA | NA |