 12
12peptides
spectra
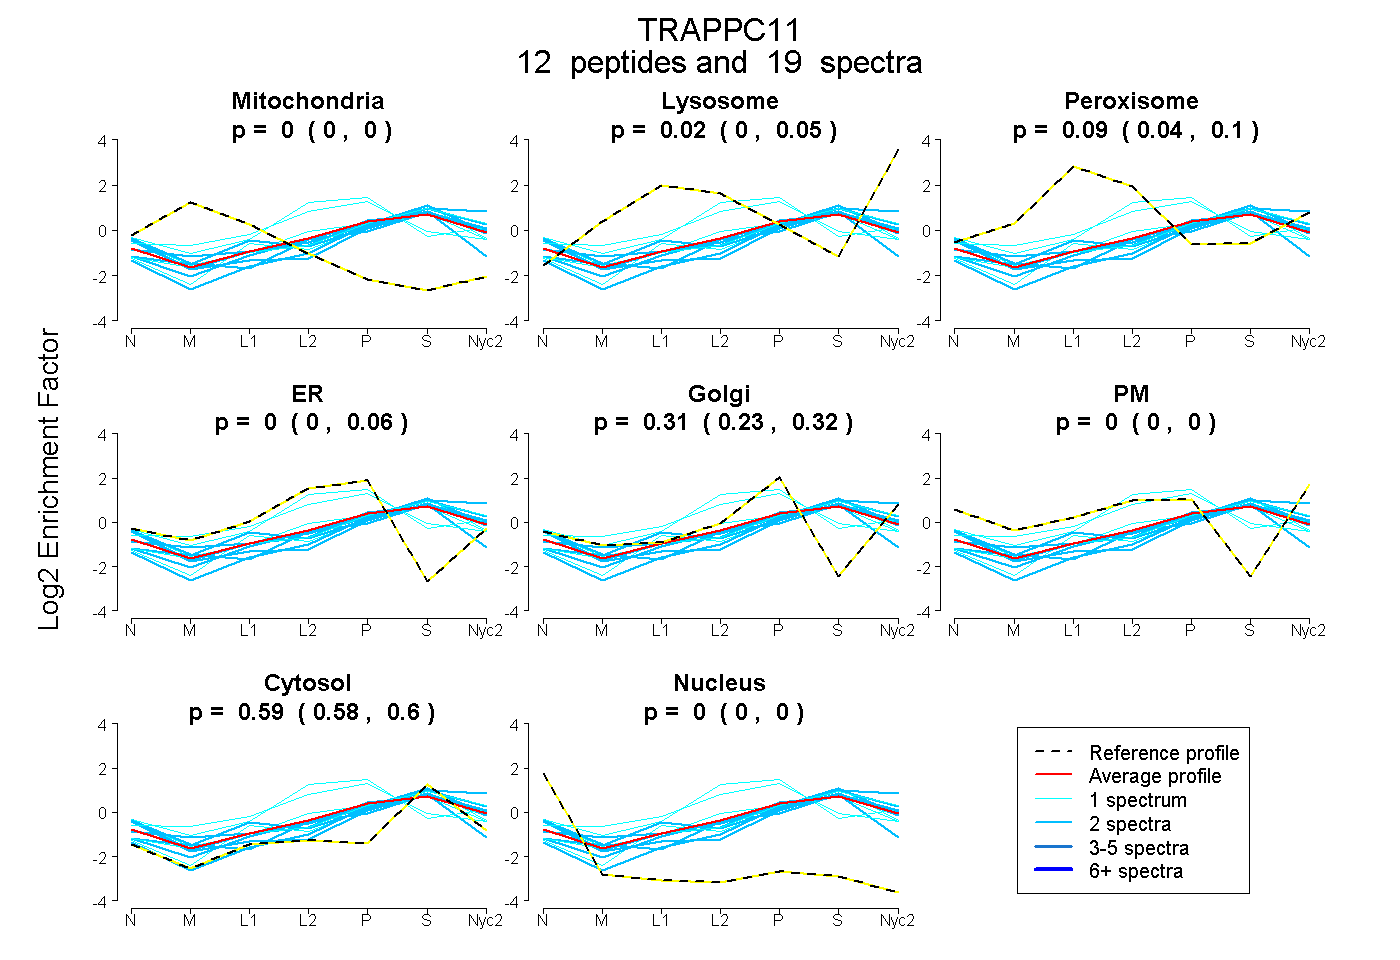
0.000 | 0.000
0.000 | 0.050
0.041 | 0.100
0.000 | 0.059
0.235 | 0.318
0.000 | 0.000
0.578 | 0.604
0.000 | 0.000
5peptides
spectra
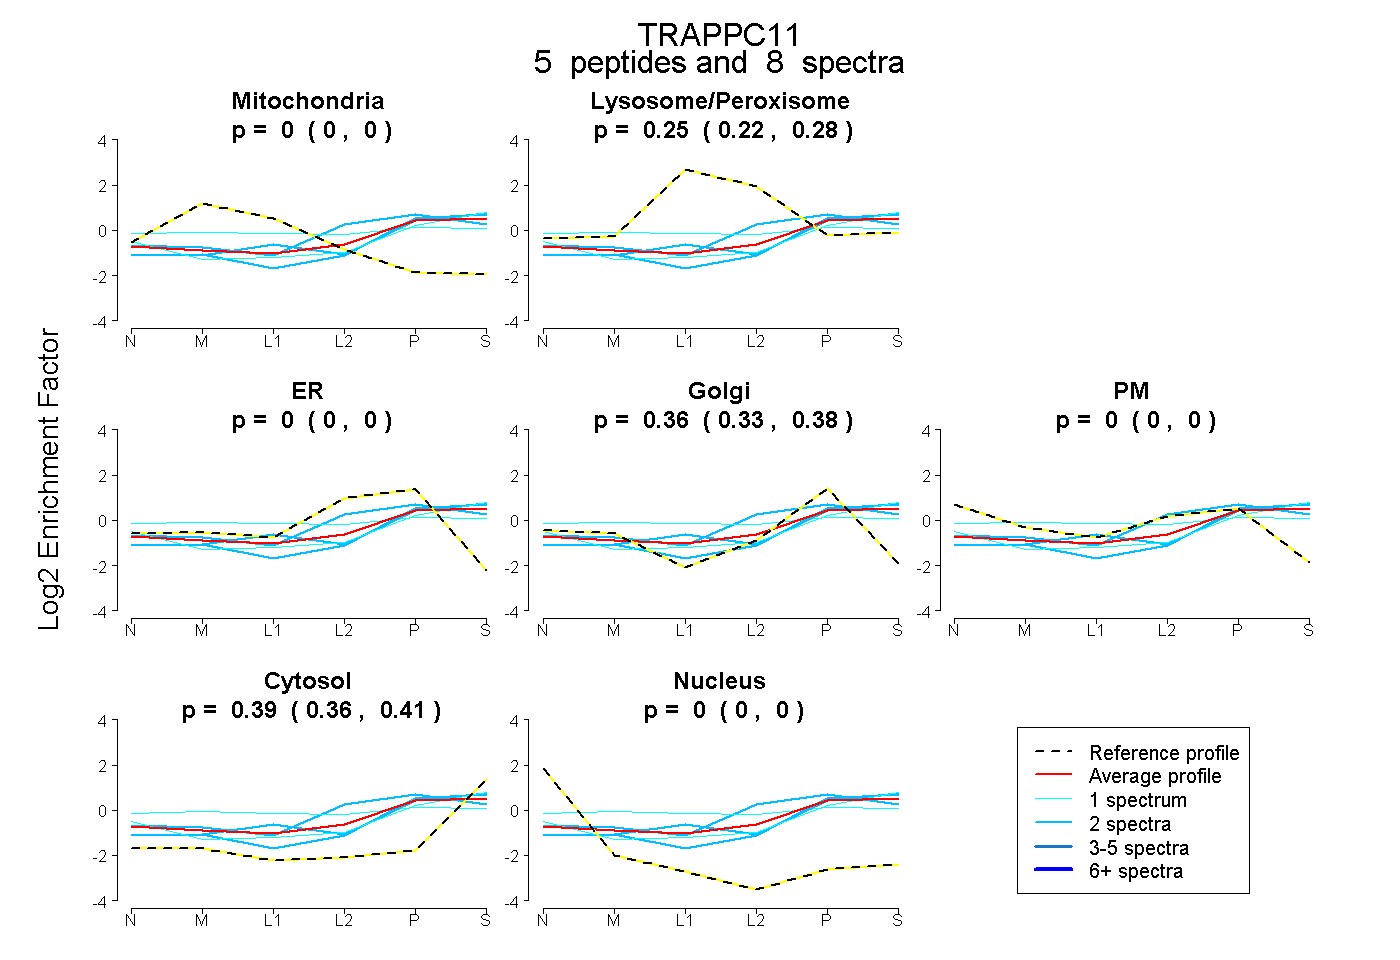
0.000 | 0.000
0.221 | 0.275
0.000 | 0.000
0.335 | 0.382
0.000 | 0.000
0.363 | 0.406
0.000 | 0.000
11peptides
spectra
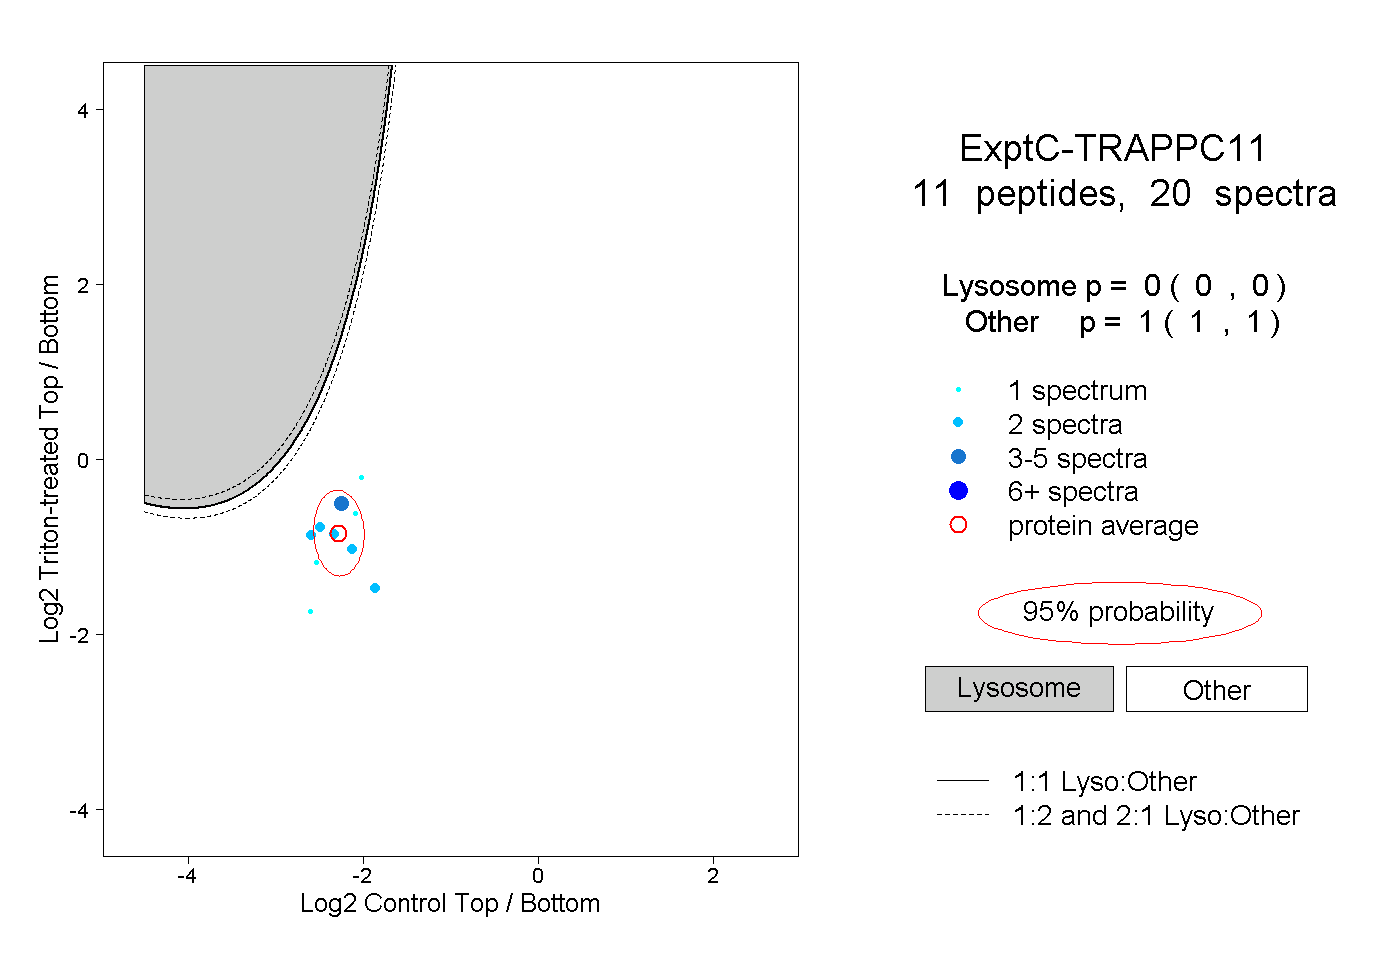
0.000 | 0.000
1.000 | 1.000
3peptides
spectra
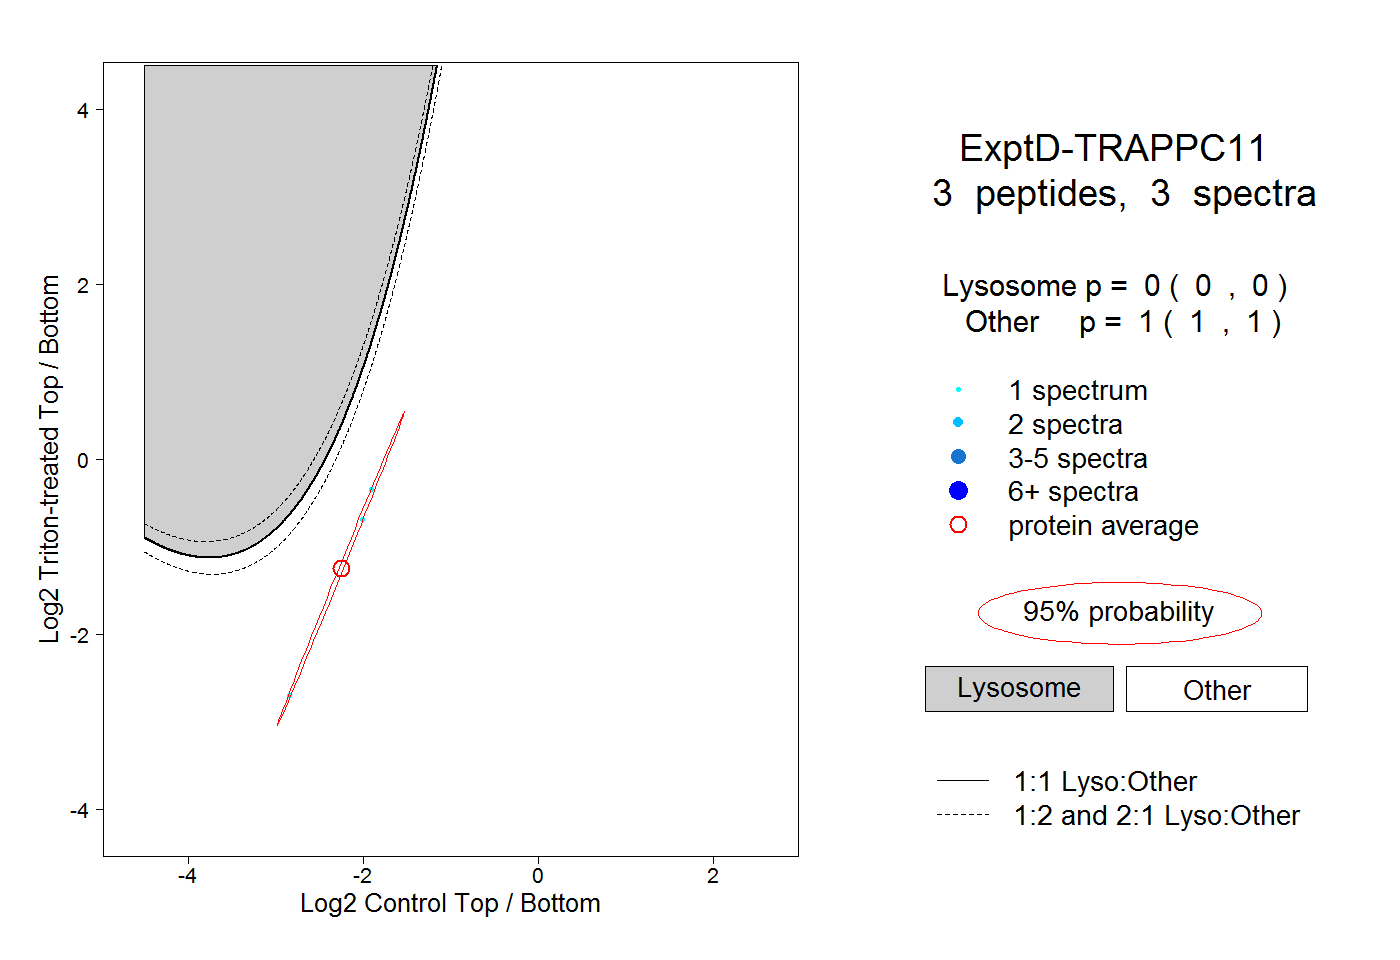
0.000 | 0.000
1.000 | 1.000