 12
12peptides
spectra
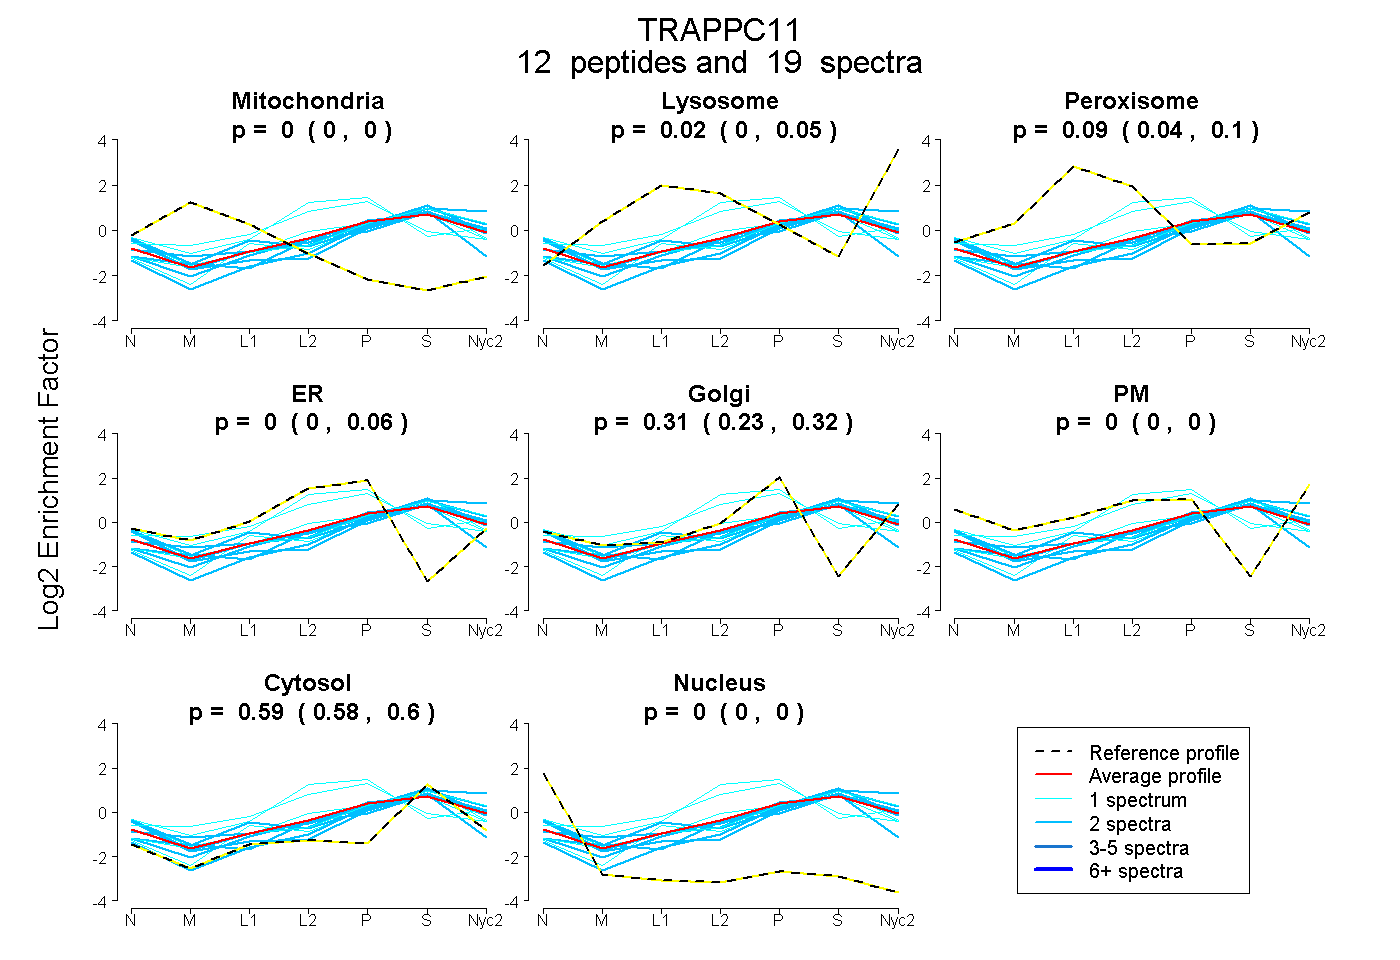
0.000 | 0.000
0.000 | 0.050
0.041 | 0.100
0.000 | 0.059
0.235 | 0.318
0.000 | 0.000
0.578 | 0.604
0.000 | 0.000
| Plot | Mito | Lyso | Perox | ER | Golgi | PM | Cytosol | Nucleus | |||||
| Expt A |
12 peptides |
19 spectra |
|
0.000 0.000 | 0.000 |
0.018 0.000 | 0.050 |
0.085 0.041 | 0.100 |
0.000 0.000 | 0.059 |
0.308 0.235 | 0.318 |
0.000 0.000 | 0.000 |
0.589 0.578 | 0.604 |
0.000 0.000 | 0.000 |
| 1 spectrum, TAYNLVHELR | 0.000 | 0.117 | 0.004 | 0.590 | 0.000 | 0.000 | 0.290 | 0.000 | ||
| 1 spectrum, VPNISVHLR | 0.000 | 0.000 | 0.151 | 0.523 | 0.000 | 0.000 | 0.326 | 0.000 | ||
| 2 spectra, VLPGDHEYPK | 0.000 | 0.270 | 0.000 | 0.000 | 0.107 | 0.000 | 0.624 | 0.000 | ||
| 1 spectrum, ASEVLENLTQGK | 0.000 | 0.019 | 0.062 | 0.000 | 0.178 | 0.000 | 0.740 | 0.000 | ||
| 2 spectra, ESLPVR | 0.000 | 0.000 | 0.000 | 0.000 | 0.258 | 0.044 | 0.698 | 0.000 | ||
| 2 spectra, FEHLER | 0.000 | 0.115 | 0.000 | 0.000 | 0.222 | 0.000 | 0.663 | 0.000 | ||
| 1 spectrum, ADCPHPIR | 0.000 | 0.000 | 0.024 | 0.237 | 0.000 | 0.115 | 0.624 | 0.000 | ||
| 2 spectra, HIDLCK | 0.019 | 0.000 | 0.026 | 0.283 | 0.000 | 0.000 | 0.673 | 0.000 | ||
| 2 spectra, TTHQLLFVR | 0.000 | 0.000 | 0.000 | 0.000 | 0.104 | 0.227 | 0.669 | 0.000 | ||
| 2 spectra, QSLQGR | 0.000 | 0.000 | 0.013 | 0.000 | 0.224 | 0.151 | 0.612 | 0.000 | ||
| 1 spectrum, VPISFK | 0.000 | 0.138 | 0.000 | 0.000 | 0.211 | 0.000 | 0.651 | 0.000 | ||
| 2 spectra, FPNFTNQLLR | 0.000 | 0.000 | 0.000 | 0.000 | 0.230 | 0.000 | 0.770 | 0.000 |
| Plot | Mito | Lyso or Perox | ER | Golgi | PM | Cytosol | Nucleus | ||||||
| Expt B |
5 peptides |
8 spectra |
 |
0.000 0.000 | 0.000 |
0.250 0.221 | 0.275 |
0.000 0.000 | 0.000 |
0.362 0.335 | 0.382 |
0.000 0.000 | 0.000 |
0.388 0.363 | 0.406 |
0.000 0.000 | 0.000 |
|||
| Plot | Lyso | Other | |||||||||||
| Expt C |
11 peptides |
20 spectra |
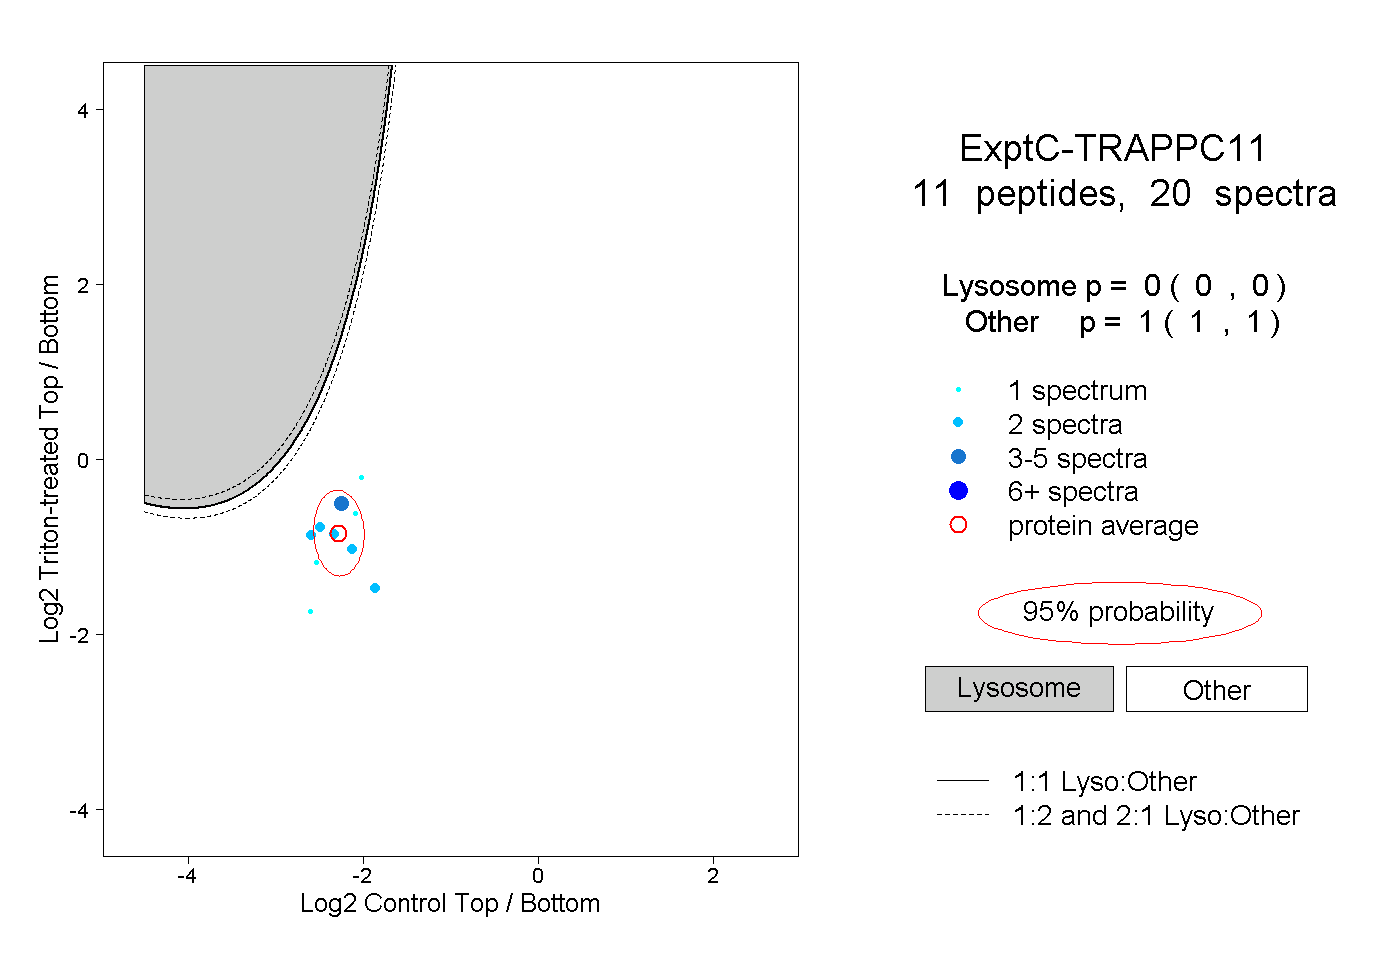 |
0.000 0.000 | 0.000 |
1.000 1.000 | 1.000 |
||||||||
| Plot | Lyso | Other | |||||||||||
| Expt D |
3 peptides |
3 spectra |
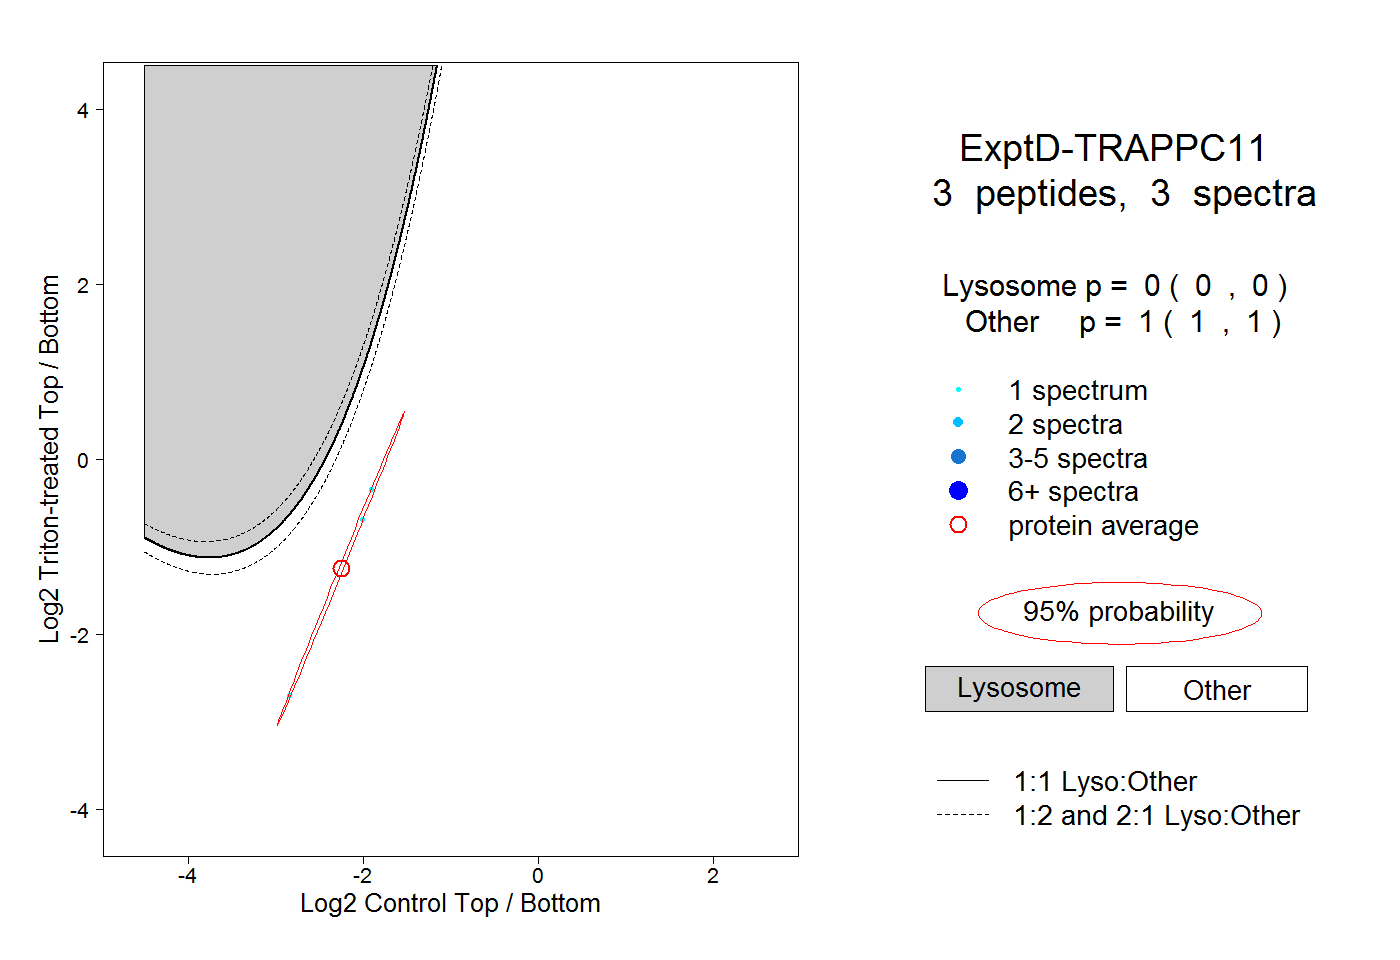 |
0.000 0.000 | 0.000 |
1.000 1.000 | 1.000 |