 9
9peptides
spectra
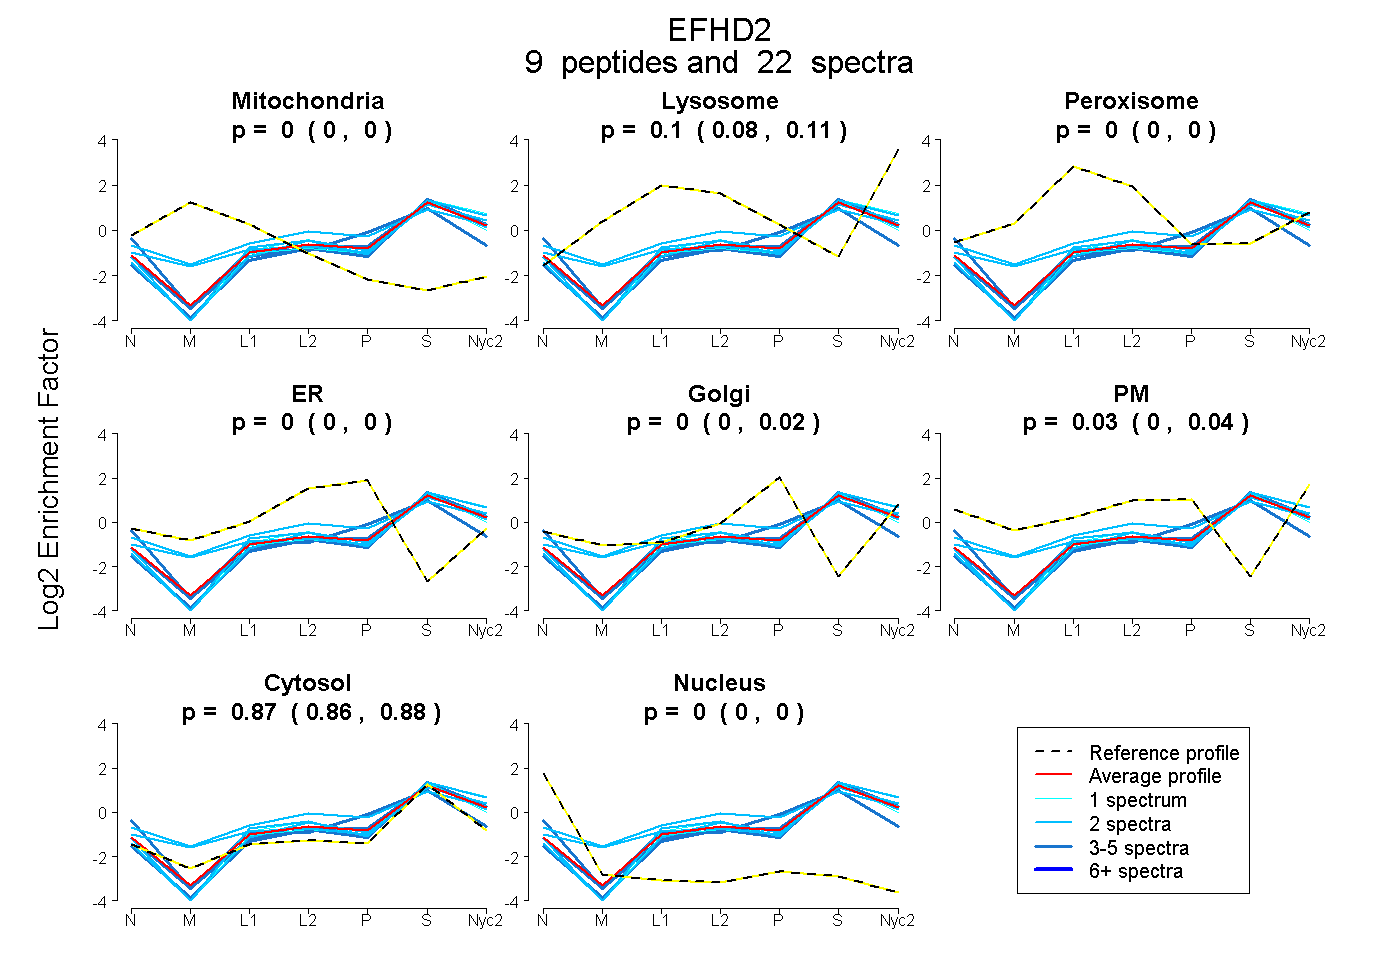
0.000 | 0.000
0.083 | 0.111
0.000 | 0.000
0.000 | 0.000
0.000 | 0.020
0.000 | 0.042
0.863 | 0.880
0.000 | 0.000
2peptides
spectra
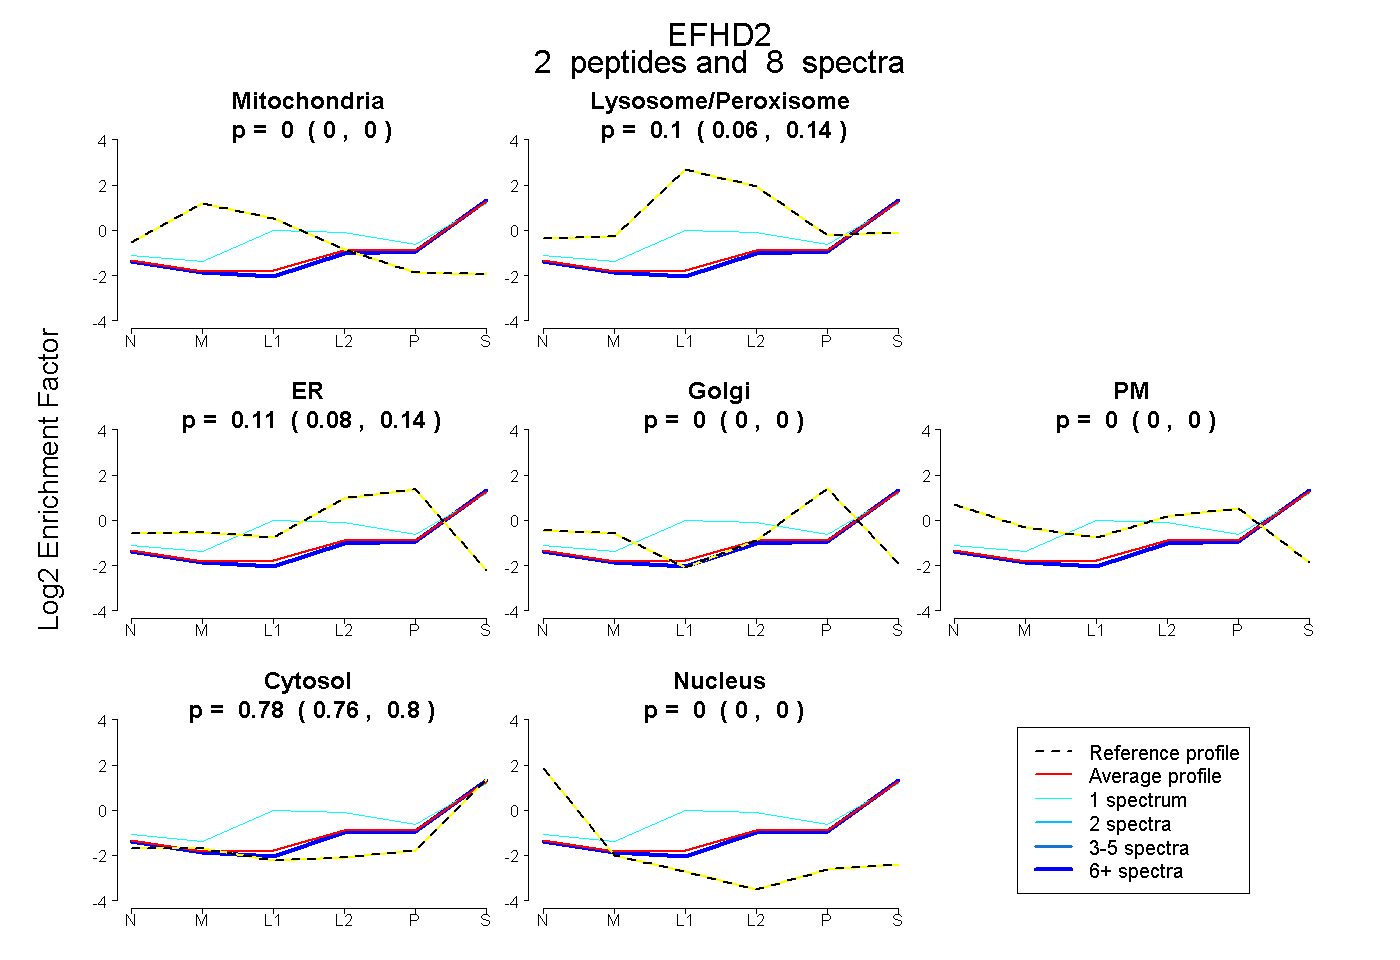
0.000 | 0.000
0.057 | 0.139
0.082 | 0.142
0.000 | 0.000
0.000 | 0.000
0.764 | 0.800
0.000 | 0.000
9peptides
spectra
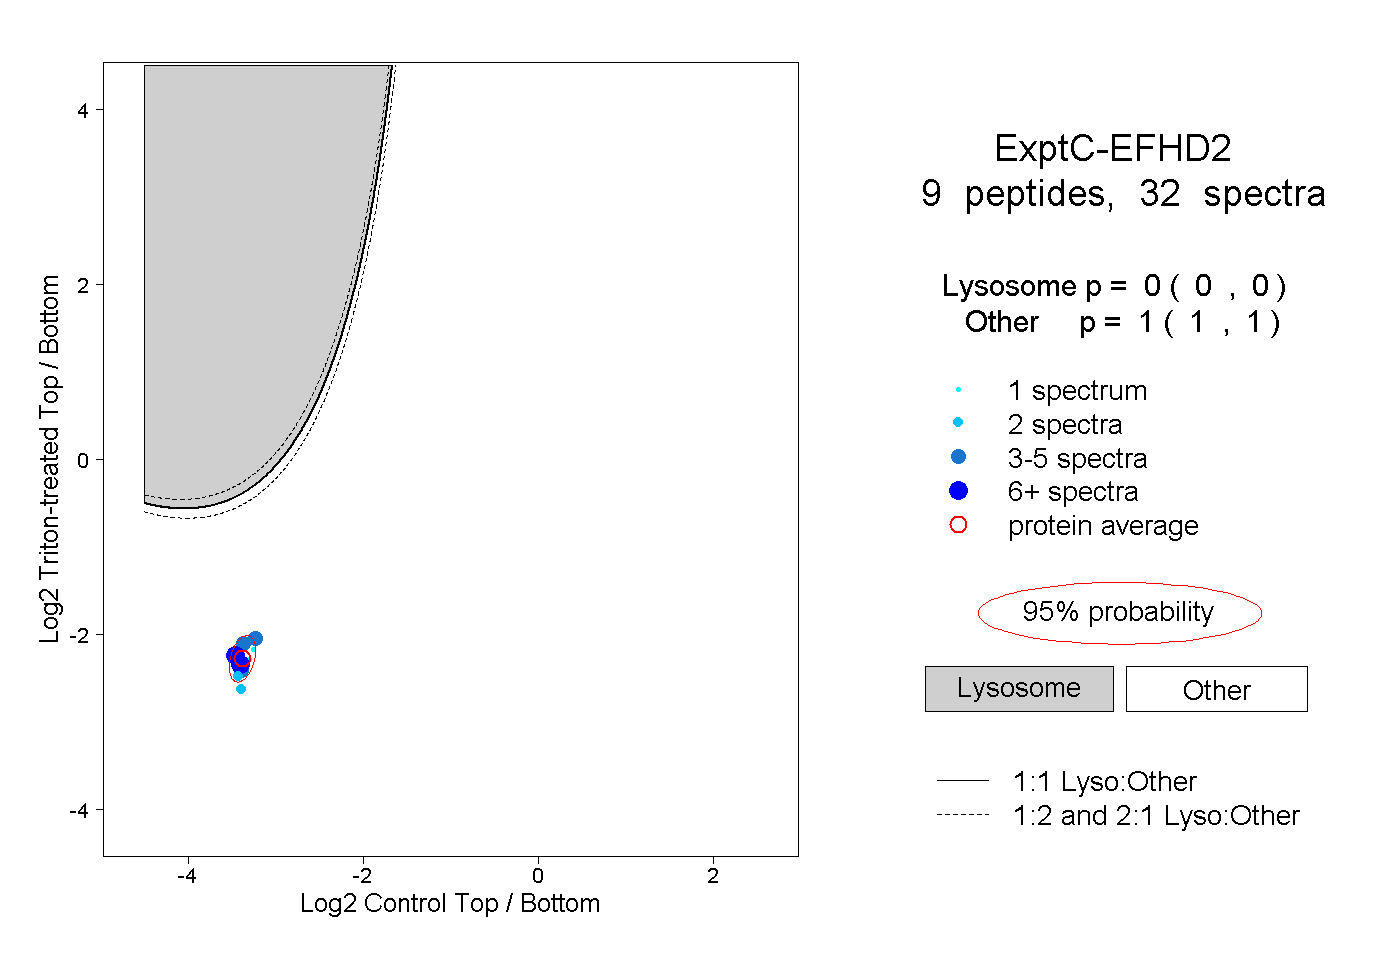
0.000 | 0.000
1.000 | 1.000
4peptides
spectra
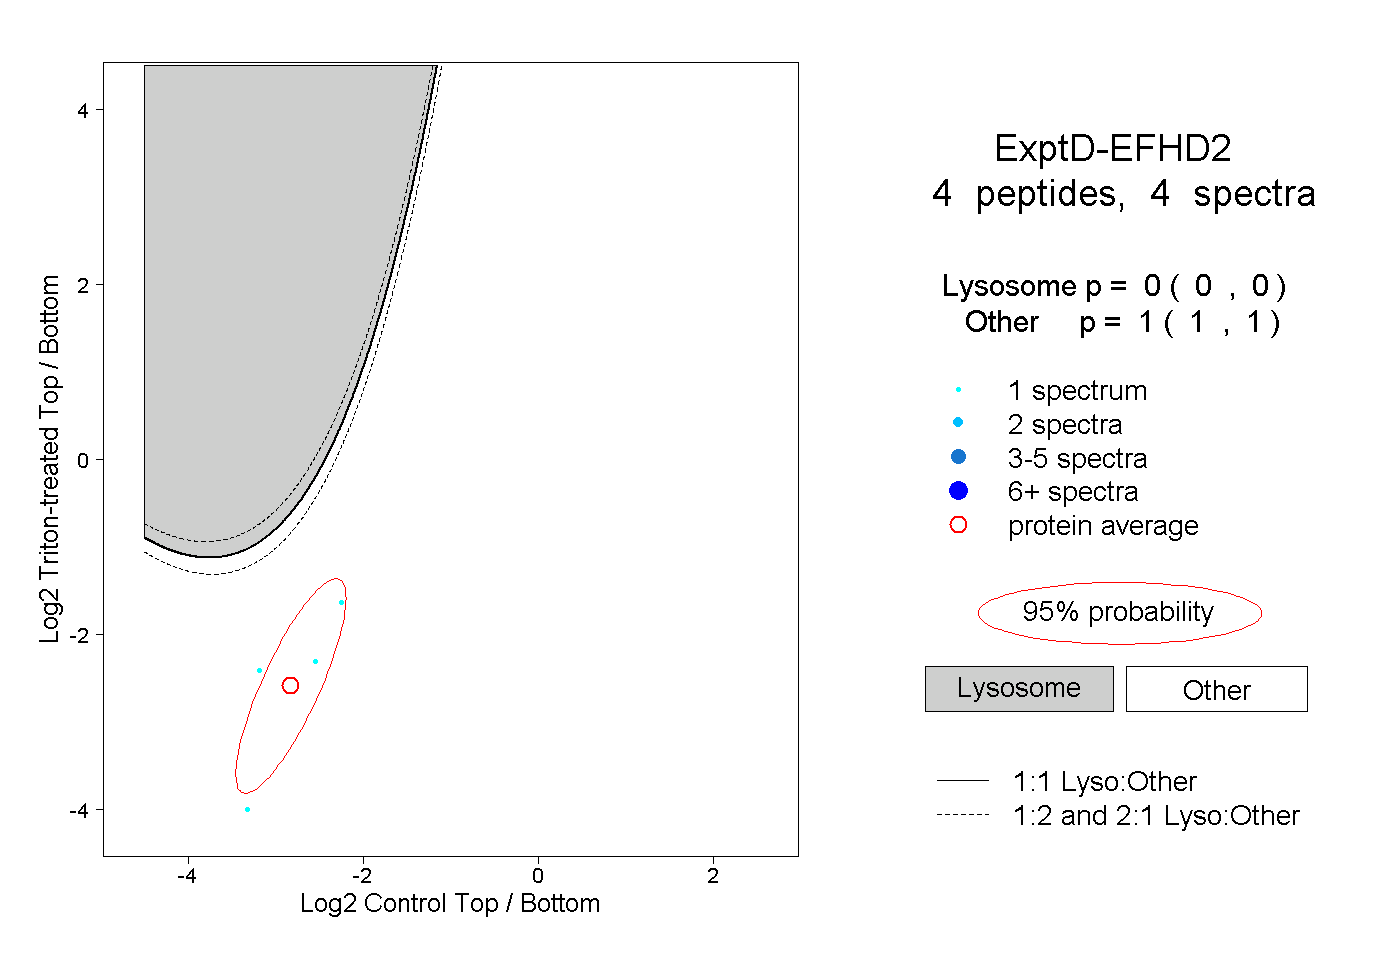
0.000 | 0.000
1.000 | 1.000