 9
9peptides
spectra
0.000 | 0.000
0.083 | 0.111
0.000 | 0.000
0.000 | 0.000
0.000 | 0.020
0.000 | 0.042
0.863 | 0.880
0.000 | 0.000
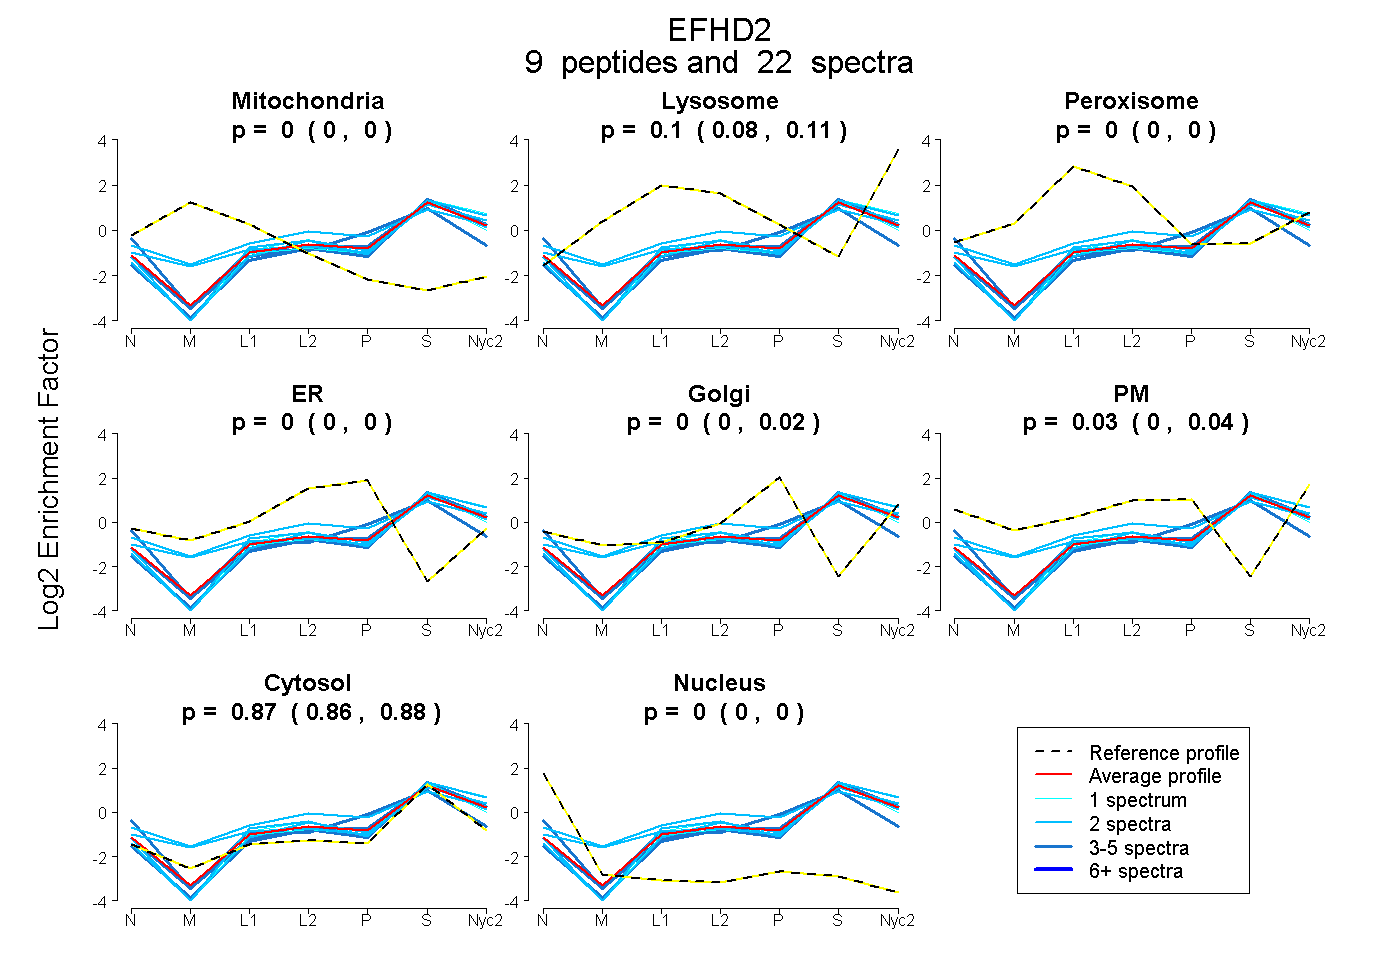
| Plot | Mito | Lyso | Perox | ER | Golgi | PM | Cytosol | Nucleus | |||||
| Expt A |
9 peptides |
22 spectra |
|
0.000 0.000 | 0.000 |
0.097 0.083 | 0.111 |
0.000 0.000 | 0.000 |
0.000 0.000 | 0.000 |
0.000 0.000 | 0.020 |
0.029 0.000 | 0.042 |
0.873 0.863 | 0.880 |
0.000 0.000 | 0.000 |
| 3 spectra, AAAGELQEDSGLHVLAR | 0.000 | 0.000 | 0.000 | 0.097 | 0.086 | 0.000 | 0.817 | 0.000 | ||
| 4 spectra, DGFIDLMELK | 0.000 | 0.076 | 0.000 | 0.000 | 0.047 | 0.000 | 0.877 | 0.000 | ||
| 1 spectrum, ADLNQGIGEPQSPSR | 0.000 | 0.125 | 0.000 | 0.000 | 0.000 | 0.000 | 0.875 | 0.000 | ||
| 2 spectra, VFNPYTEFK | 0.000 | 0.216 | 0.000 | 0.000 | 0.000 | 0.014 | 0.770 | 0.000 | ||
| 2 spectra, QYDAGK | 0.000 | 0.095 | 0.092 | 0.000 | 0.000 | 0.173 | 0.640 | 0.000 | ||
| 5 spectra, EFLLIFR | 0.000 | 0.052 | 0.000 | 0.000 | 0.000 | 0.000 | 0.948 | 0.000 | ||
| 2 spectra, VQAINVSSR | 0.000 | 0.130 | 0.000 | 0.000 | 0.000 | 0.000 | 0.870 | 0.000 | ||
| 1 spectrum, LSEIDVSTEGVK | 0.000 | 0.043 | 0.000 | 0.000 | 0.000 | 0.000 | 0.957 | 0.000 | ||
| 2 spectra, LGAPQTHLGLK | 0.000 | 0.063 | 0.000 | 0.000 | 0.000 | 0.006 | 0.930 | 0.000 |
| Plot | Mito | Lyso or Perox | ER | Golgi | PM | Cytosol | Nucleus | ||||||
| Expt B |
2 peptides |
8 spectra |
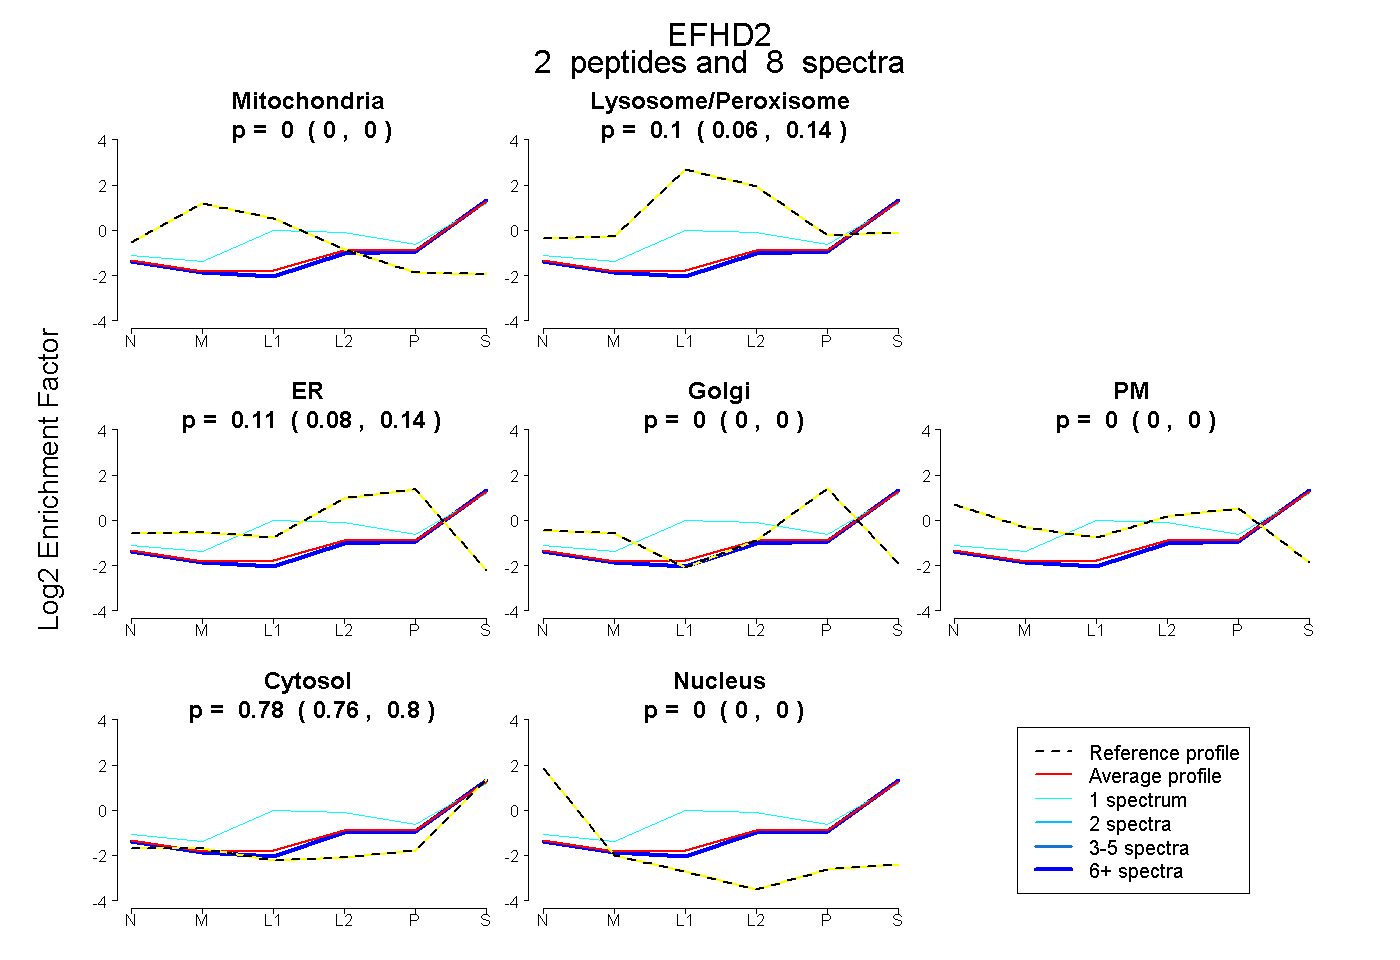 |
0.000 0.000 | 0.000 |
0.101 0.057 | 0.139 |
0.114 0.082 | 0.142 |
0.000 0.000 | 0.000 |
0.000 0.000 | 0.000 |
0.784 0.764 | 0.800 |
0.000 0.000 | 0.000 |
|||
| Plot | Lyso | Other | |||||||||||
| Expt C |
9 peptides |
32 spectra |
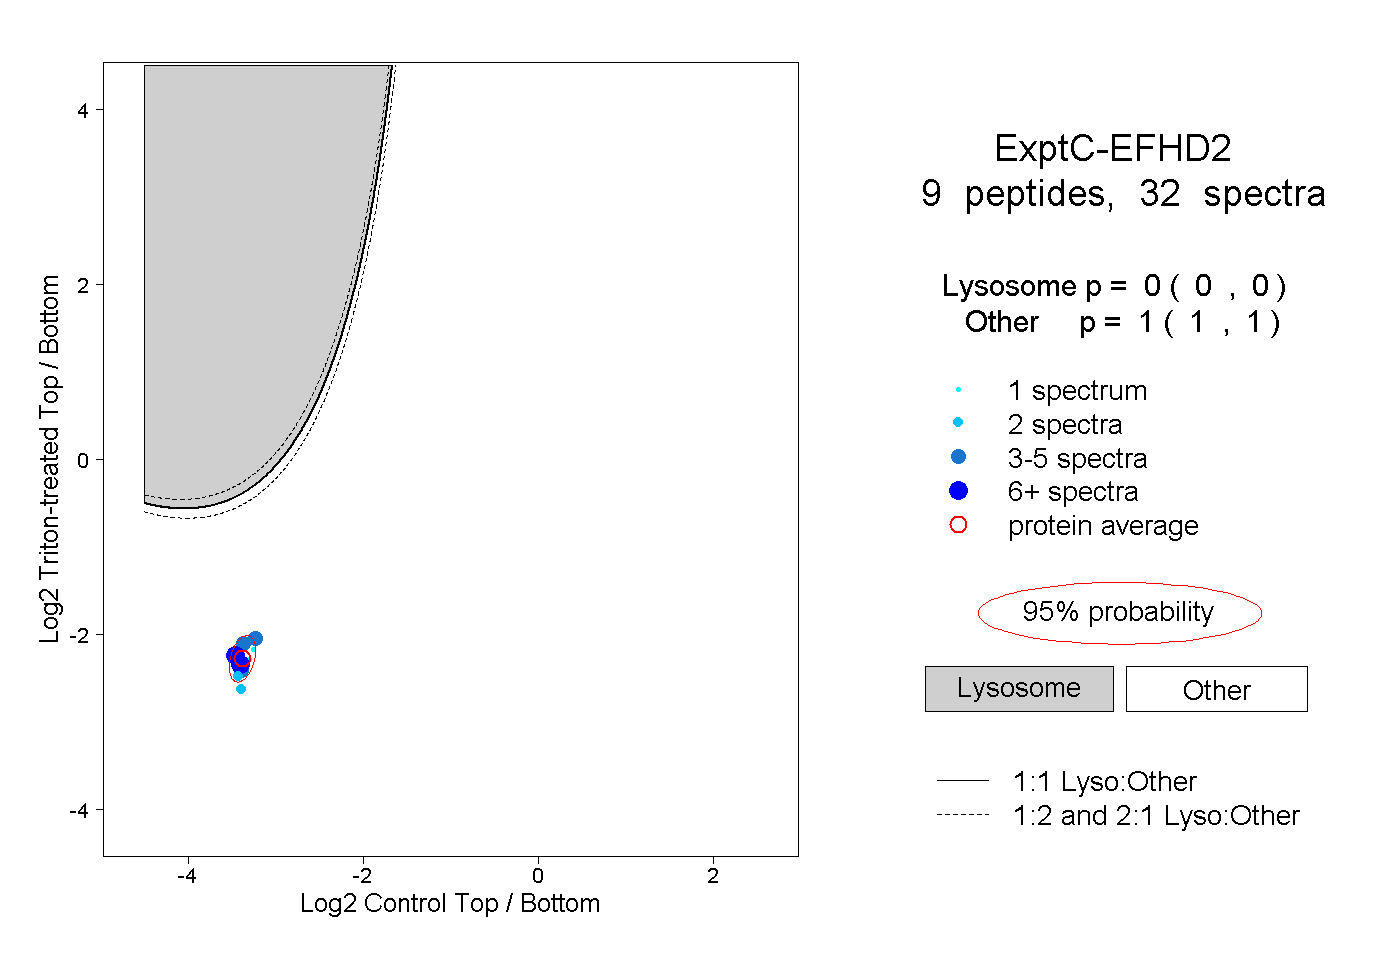 |
0.000 0.000 | 0.000 |
1.000 1.000 | 1.000 |
||||||||
| Plot | Lyso | Other | |||||||||||
| Expt D |
4 peptides |
4 spectra |
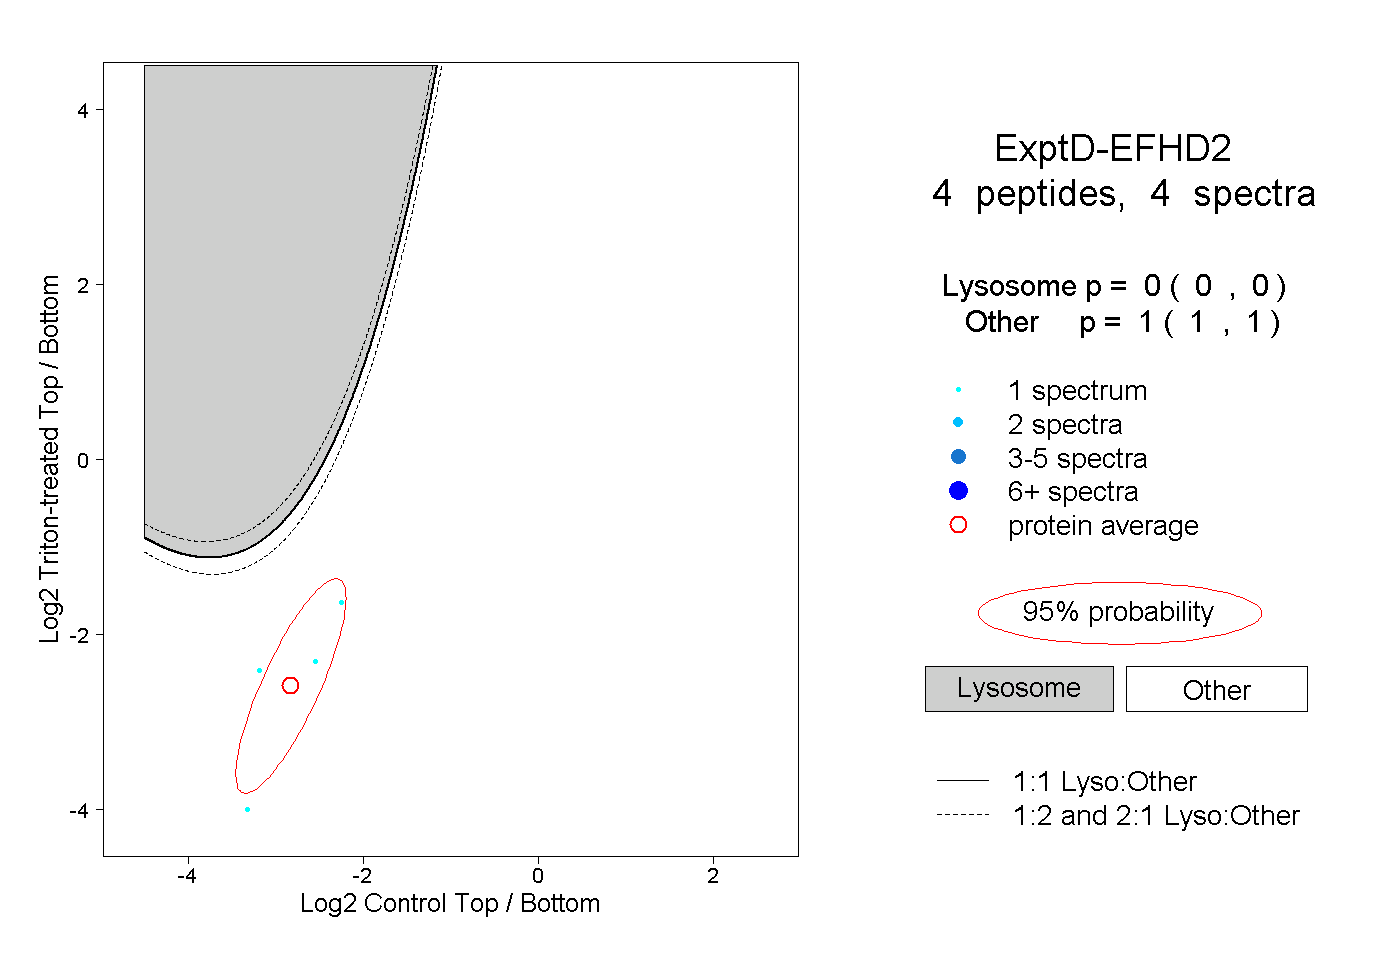 |
0.000 0.000 | 0.000 |
1.000 1.000 | 1.000 |