 8
8peptides
spectra
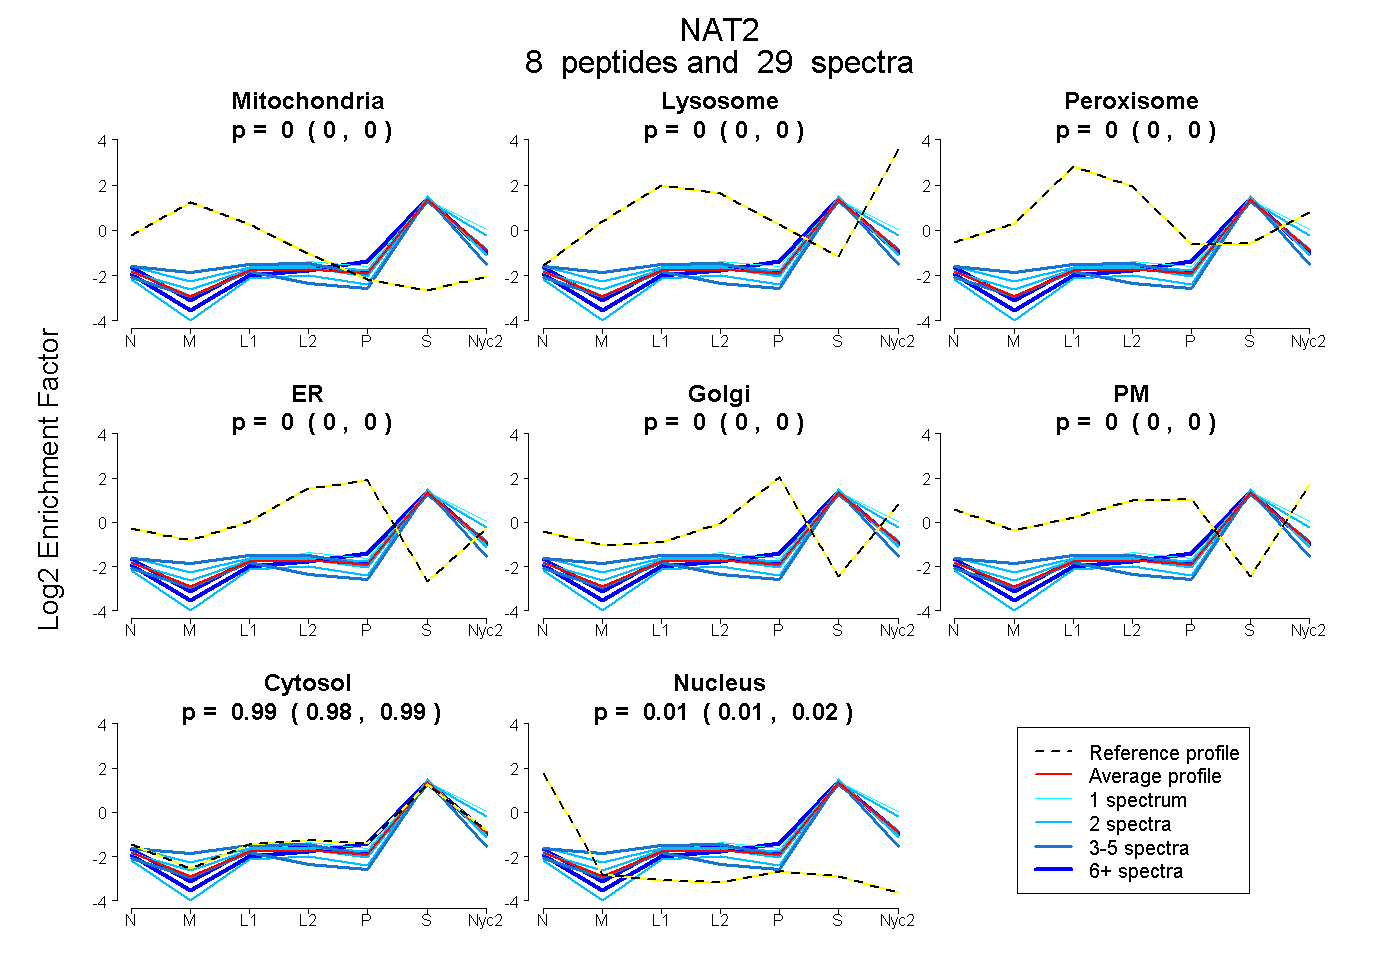
0.000 | 0.000
0.000 | 0.000
0.000 | 0.000
0.000 | 0.000
0.000 | 0.000
0.000 | 0.000
0.981 | 0.991
0.008 | 0.018
5peptides
spectra
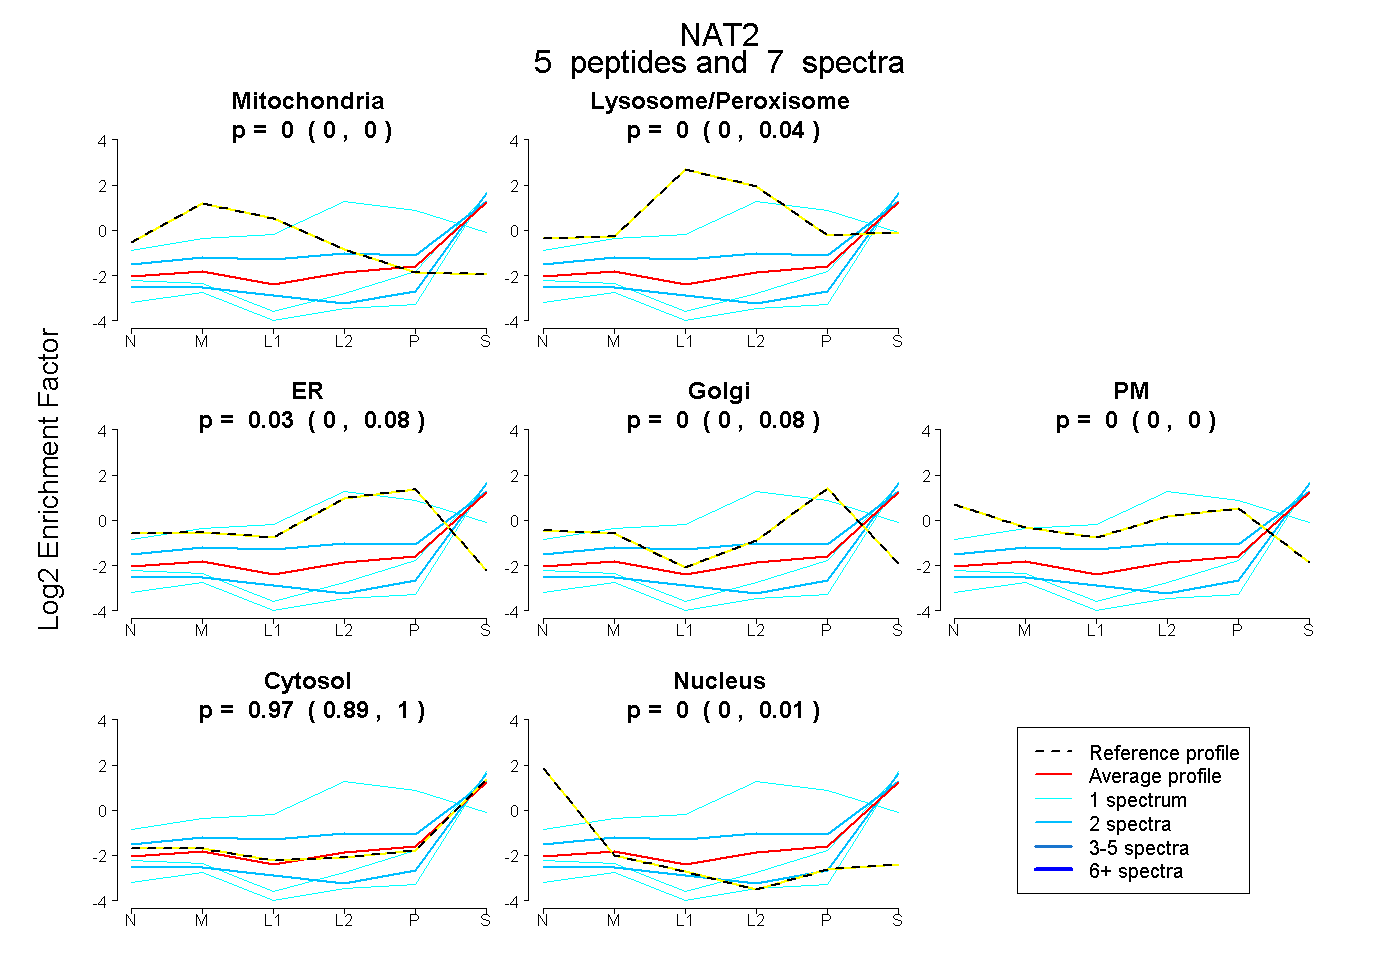
0.000 | 0.000
0.000 | 0.036
0.000 | 0.082
0.000 | 0.075
0.000 | 0.000
0.886 | 1.000
0.000 | 0.007
5peptides
spectra
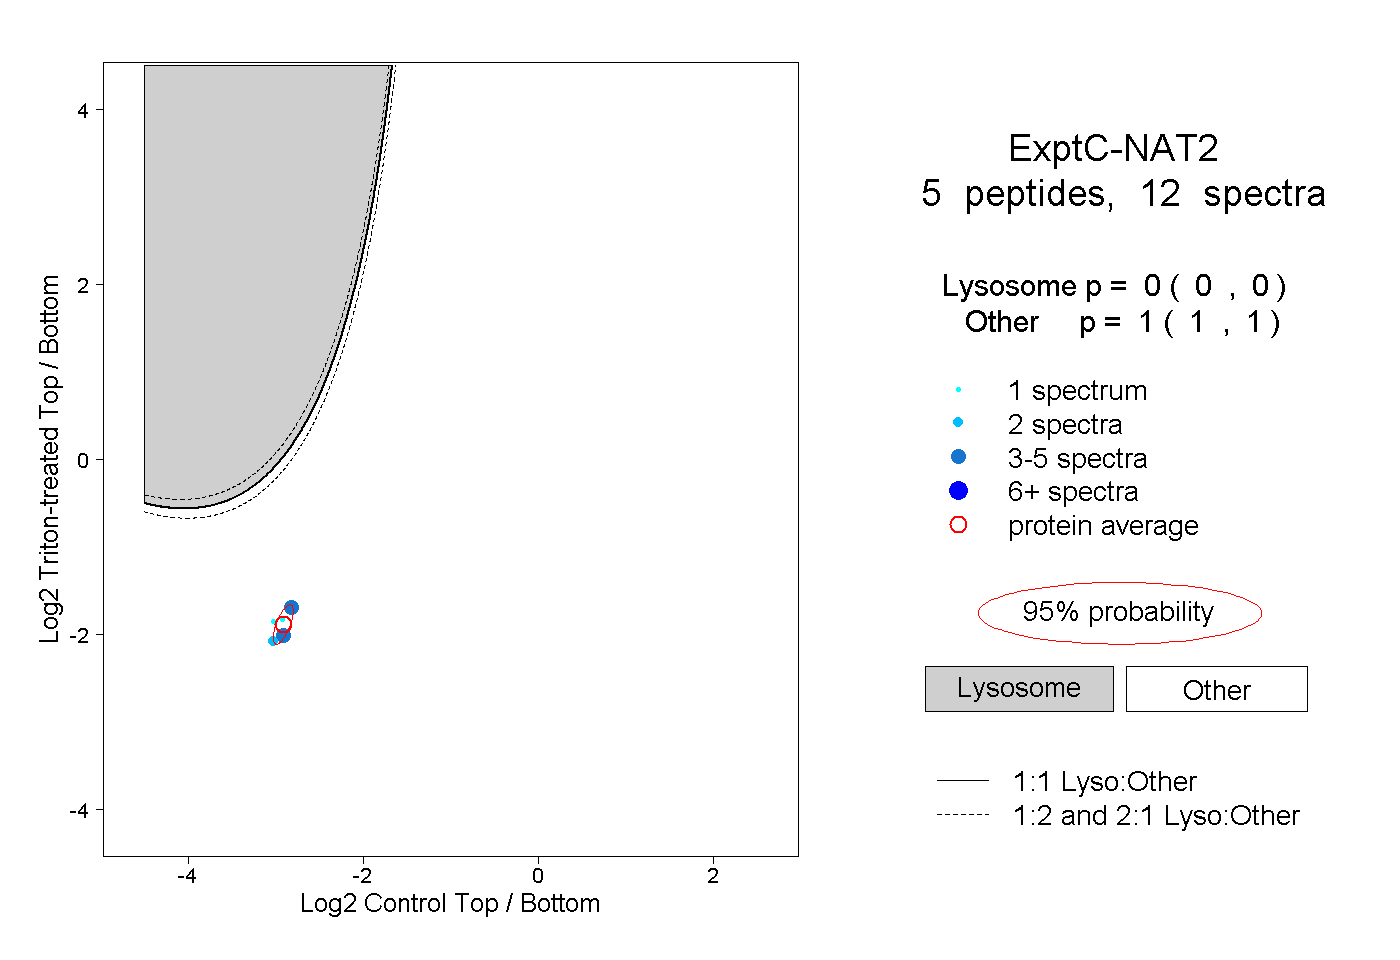
0.000 | 0.000
1.000 | 1.000