NAT2
[ENSRNOP00000018854]
Main page
| | | Plot |
Mito |
Lyso |
|
Perox |
ER |
Golgi |
PM |
Cytosol |
Nucleus |
|
| Expt A |
 8
8
peptides |
29
spectra |
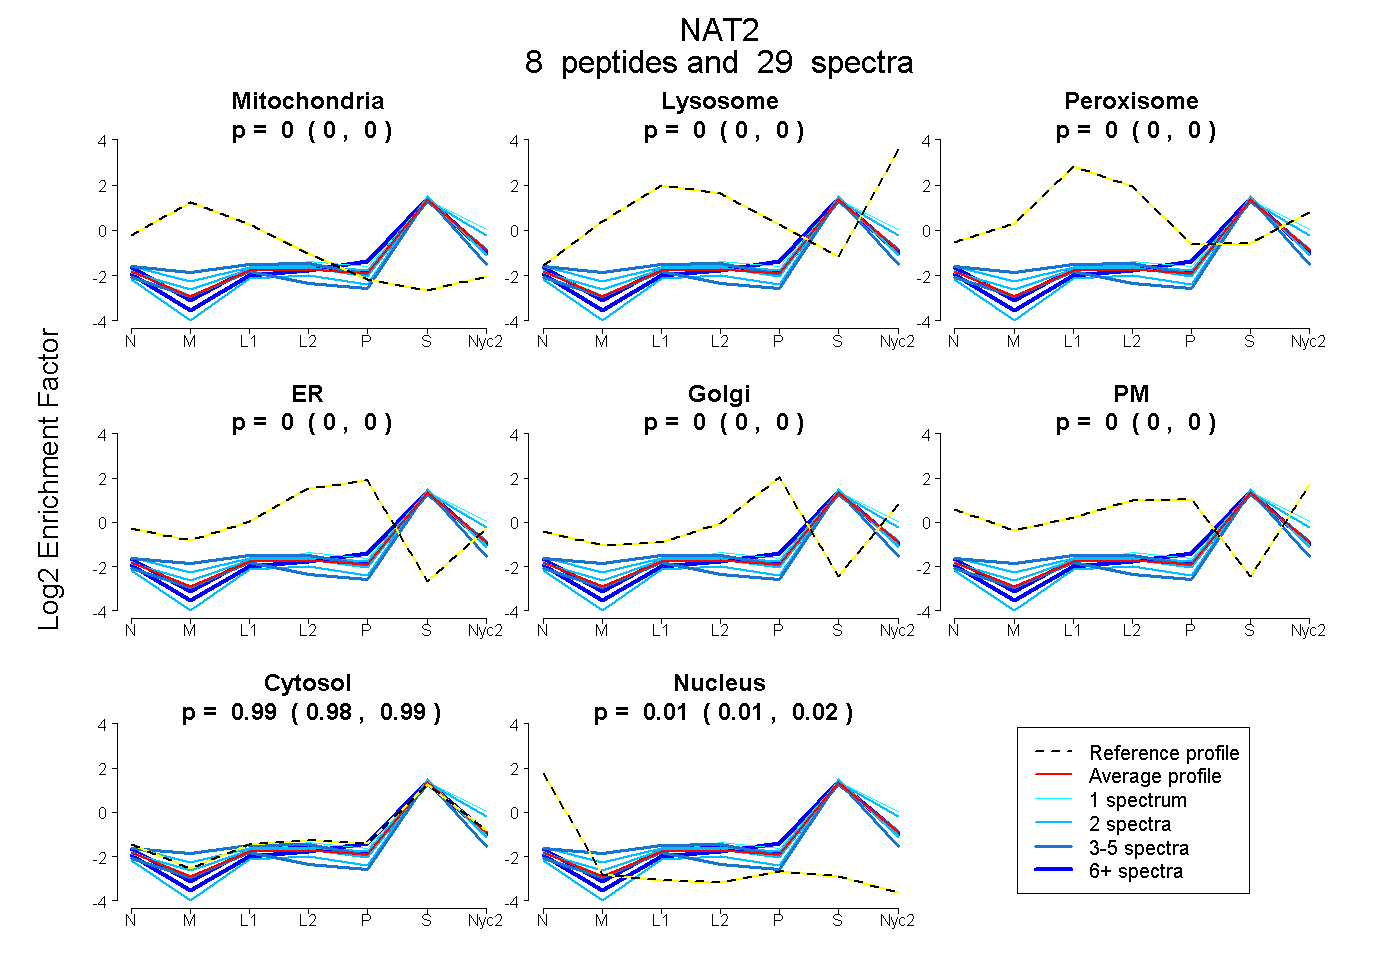 |
0.000
0.000 | 0.000 |
0.000
0.000 | 0.000 |
|
0.000
0.000 | 0.000 |
0.000
0.000 | 0.000 |
0.000
0.000 | 0.000 |
0.000
0.000 | 0.000 |
0.987
0.981 | 0.991 |
0.013
0.008 | 0.018 |
|
| | | Plot |
Mito |
|
Lyso or Perox |
|
ER |
Golgi |
PM |
Cytosol |
Nucleus |
|
| Expt B |
5
peptides |
7
spectra |
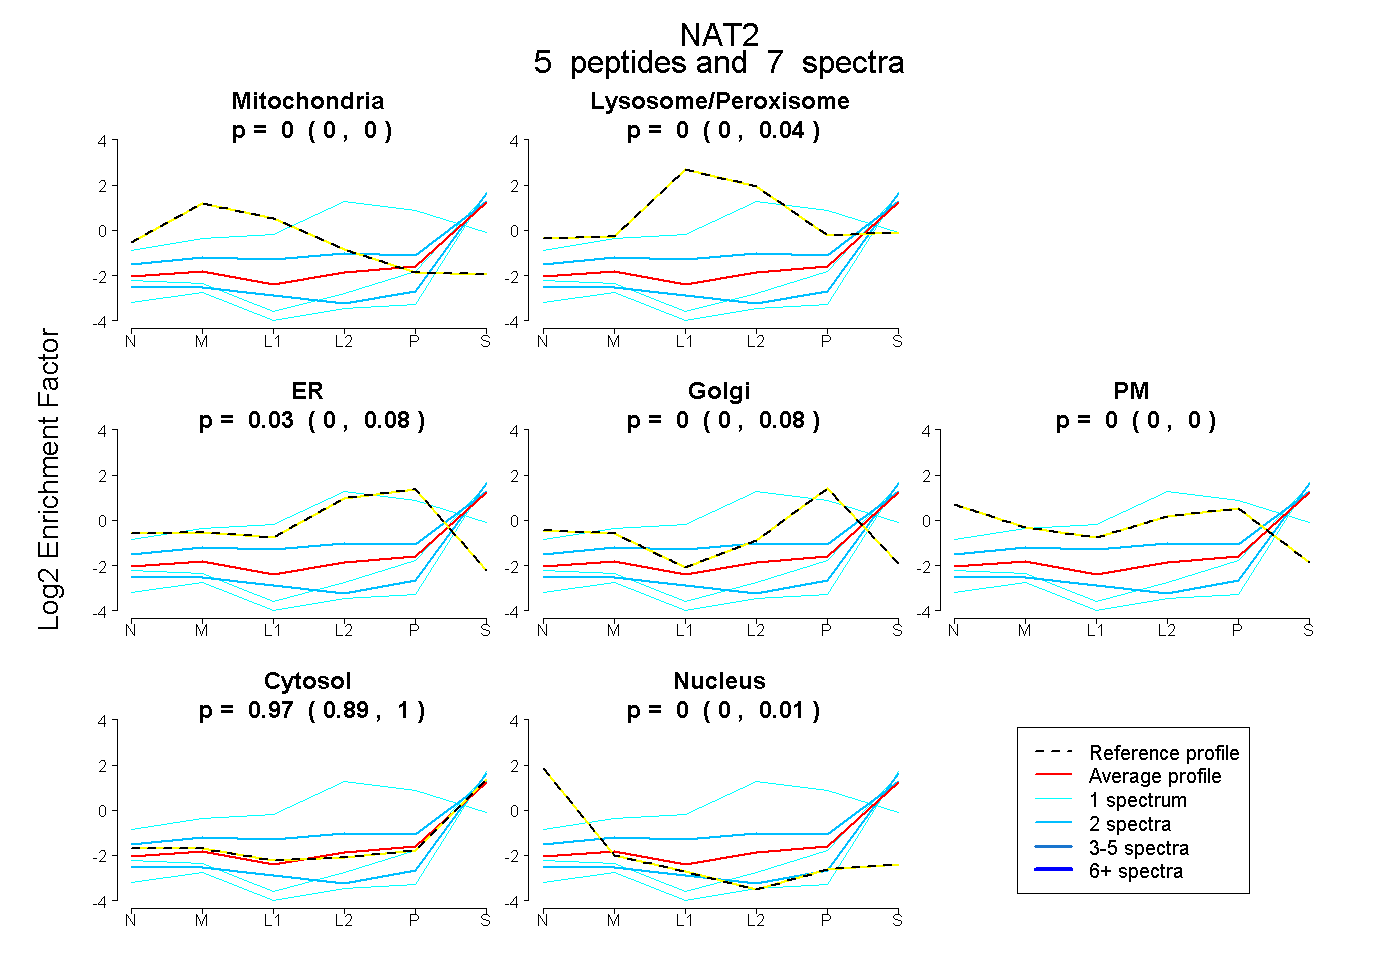 |
0.000
0.000 | 0.000 |
|
0.000
0.000 | 0.036 |
|
0.027
0.000 | 0.082 |
0.000
0.000 | 0.075 |
0.000
0.000 | 0.000 |
0.973
0.886 | 1.000 |
0.000
0.000 | 0.007 |
|
| 2 spectra, SLTEEEIEDVLK |
0.000 |
|
0.206 |
|
0.029 |
0.000 |
0.000 |
0.765 |
0.000 |
|
| 1 spectrum, DNVDLVEFK |
0.000 |
|
0.000 |
|
0.000 |
0.000 |
0.000 |
1.000 |
0.000 |
|
| 1 spectrum, DQPQVPAVFR |
0.000 |
|
0.342 |
|
0.492 |
0.000 |
0.000 |
0.166 |
0.000 |
|
| 2 spectra, IYSFTLEPR |
0.000 |
|
0.000 |
|
0.000 |
0.000 |
0.000 |
1.000 |
0.000 |
|
| 1 spectrum, HGELVFTI |
0.000 |
|
0.000 |
|
0.000 |
0.000 |
0.000 |
1.000 |
0.000 |
|
| | | Plot |
|
Lyso |
|
|
|
|
|
|
|
Other |
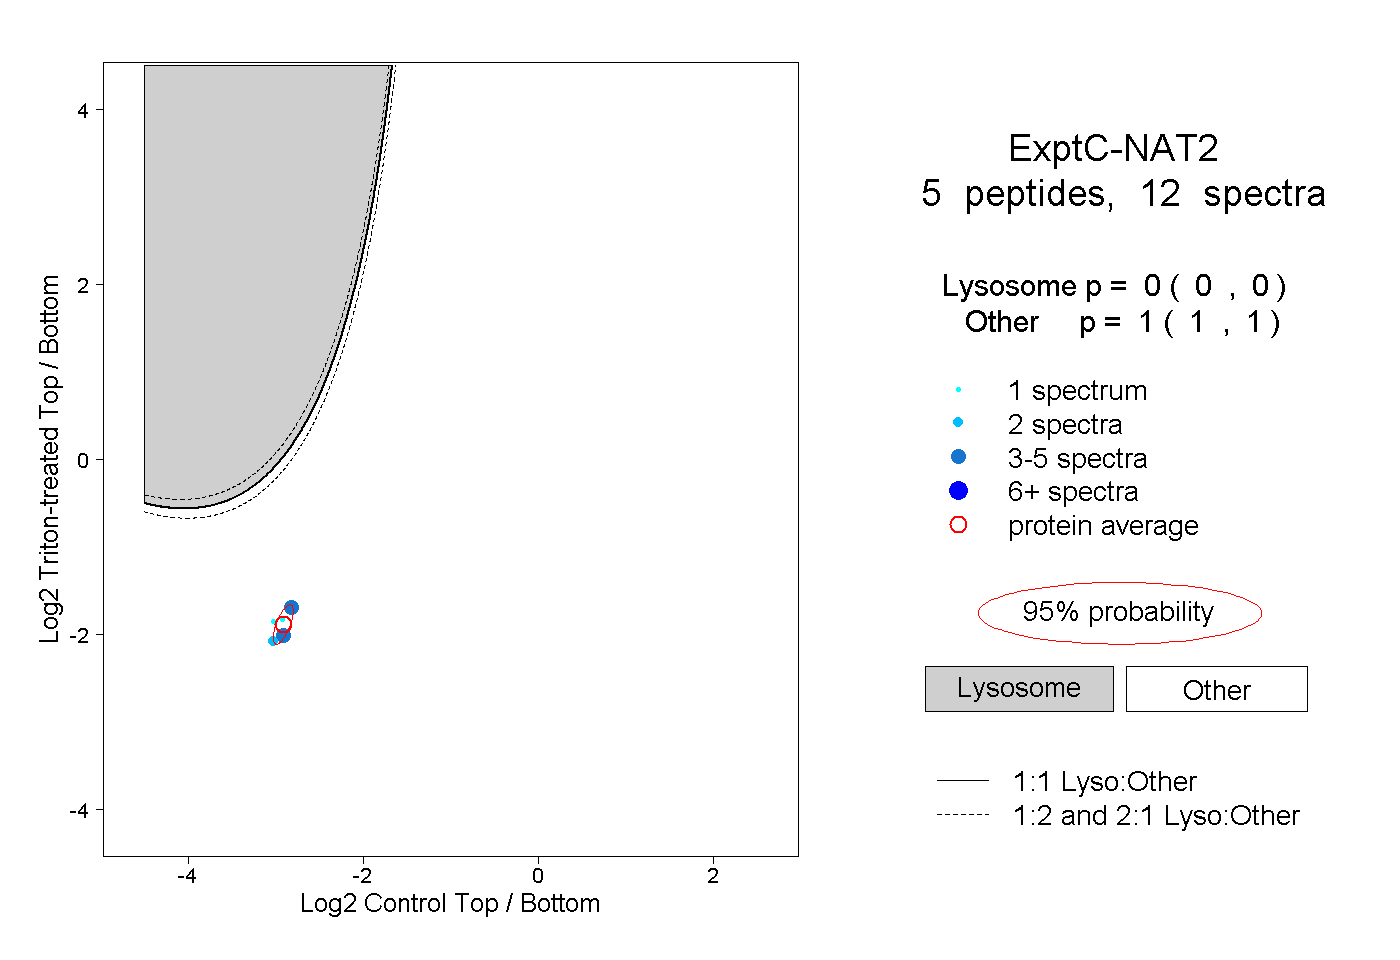
| Expt C |
5
peptides |
12
spectra |
 |
|
0.000
0.000 | 0.000 |
|
|
|
|
|
|
|
1.000
1.000 | 1.000 |