 1
1peptide
spectra
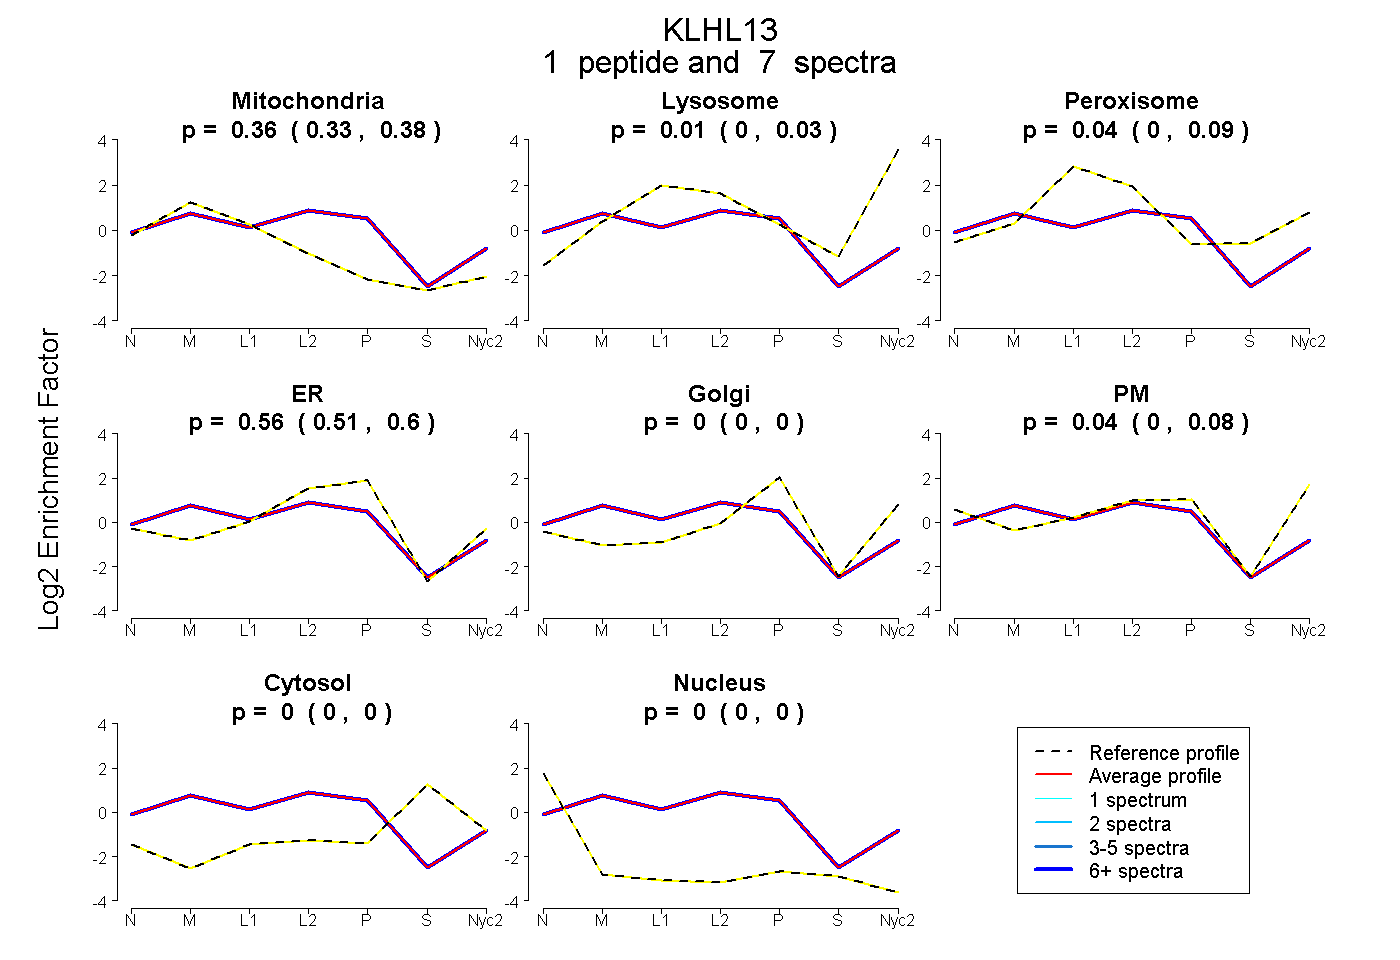
0.330 | 0.383
0.000 | 0.033
0.000 | 0.094
0.507 | 0.595
0.000 | 0.000
0.000 | 0.080
0.000 | 0.000
0.000 | 0.000
2peptides
spectra
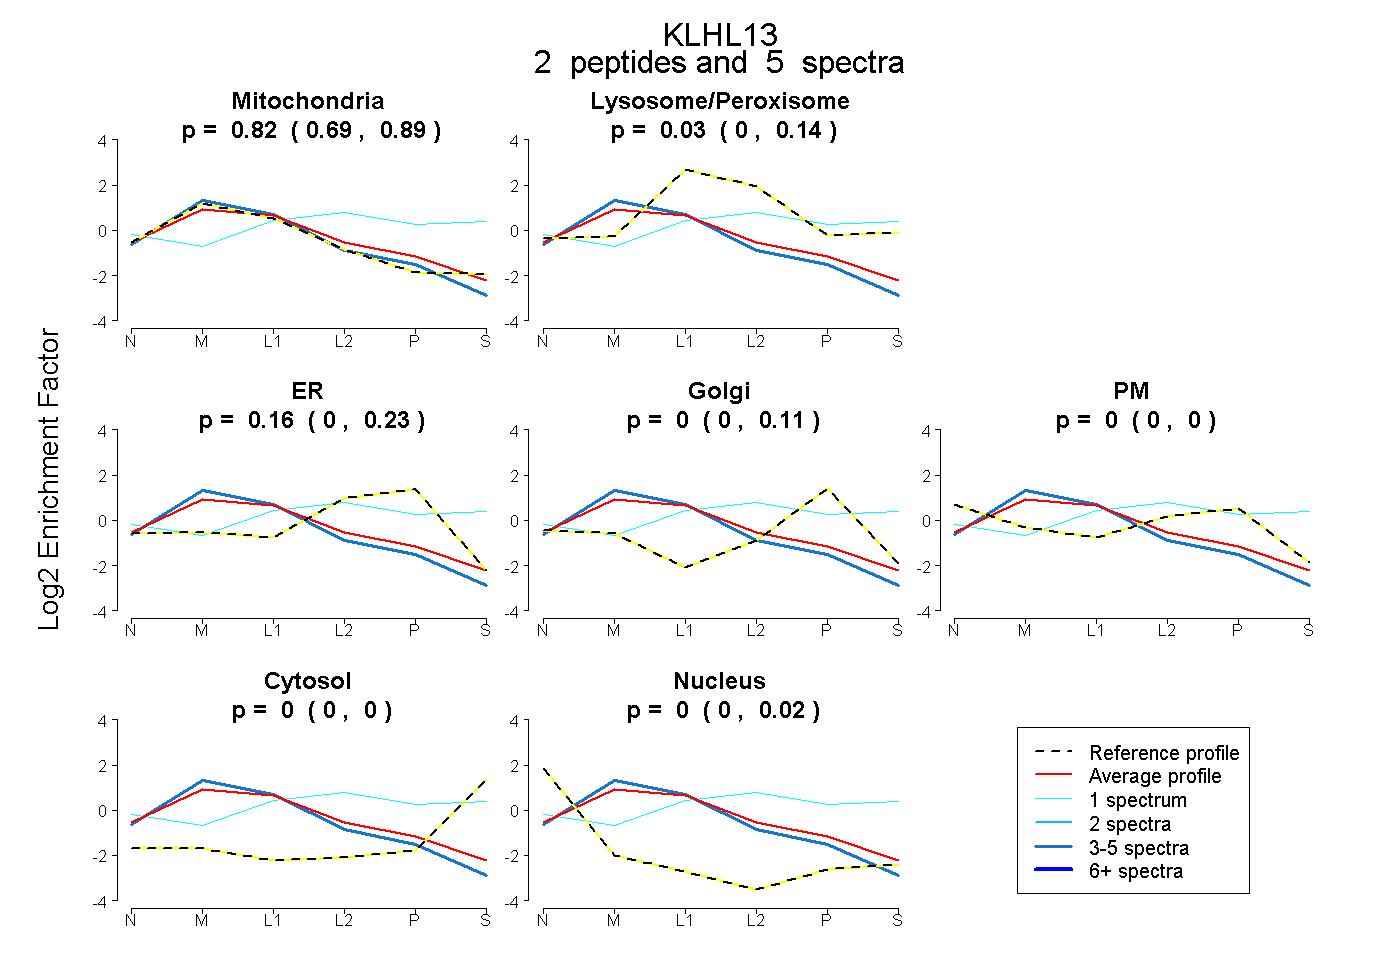
0.690 | 0.888
0.000 | 0.138
0.000 | 0.227
0.000 | 0.106
0.000 | 0.000
0.000 | 0.000
0.000 | 0.015
1peptide
spectra
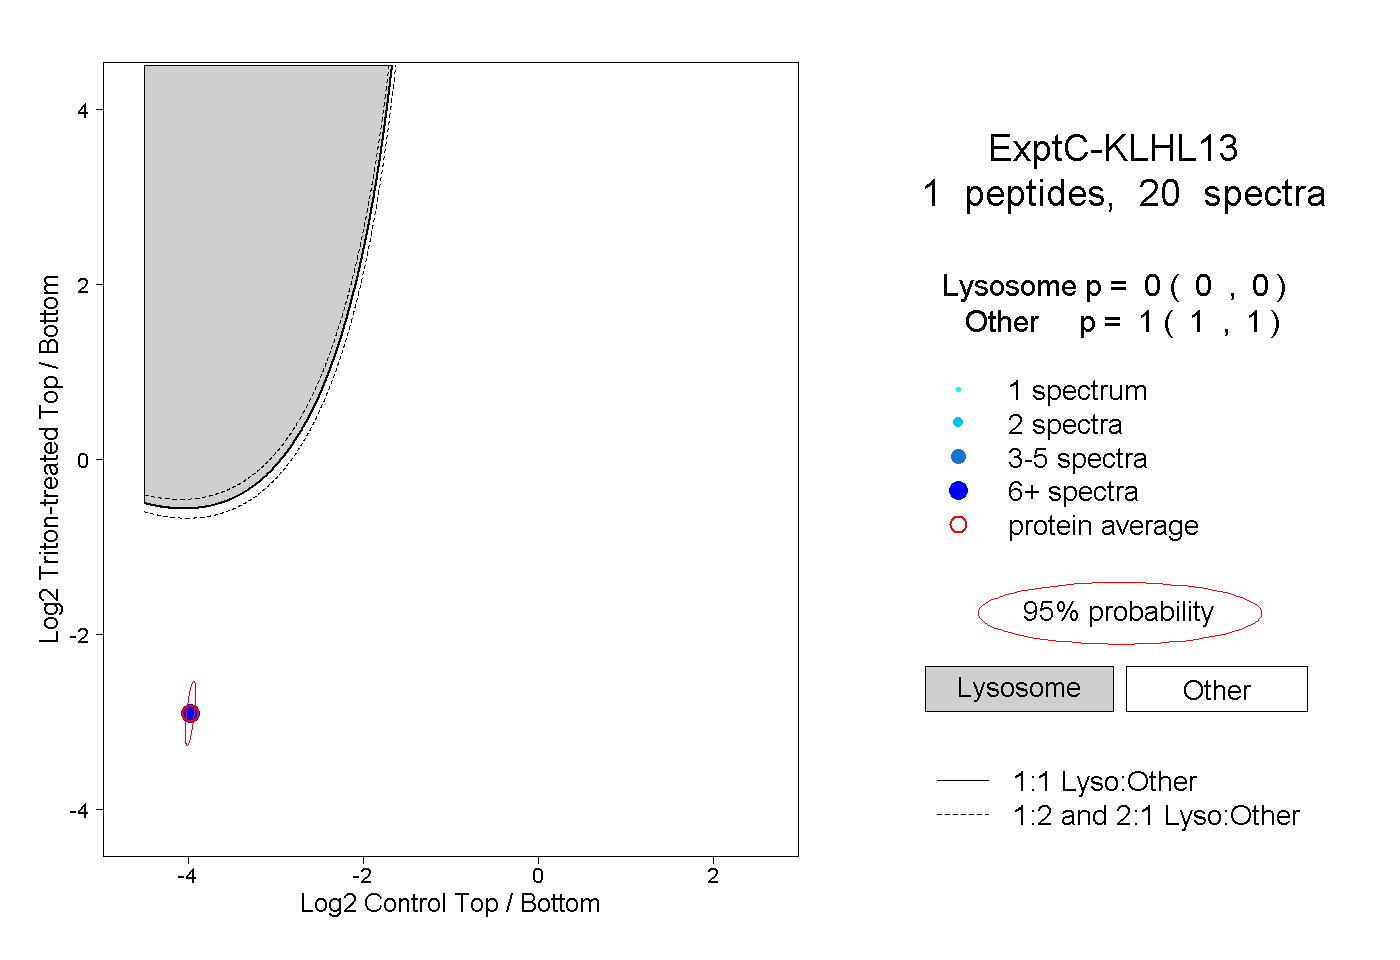
0.000 | 0.000
1.000 | 1.000
1peptide
spectra
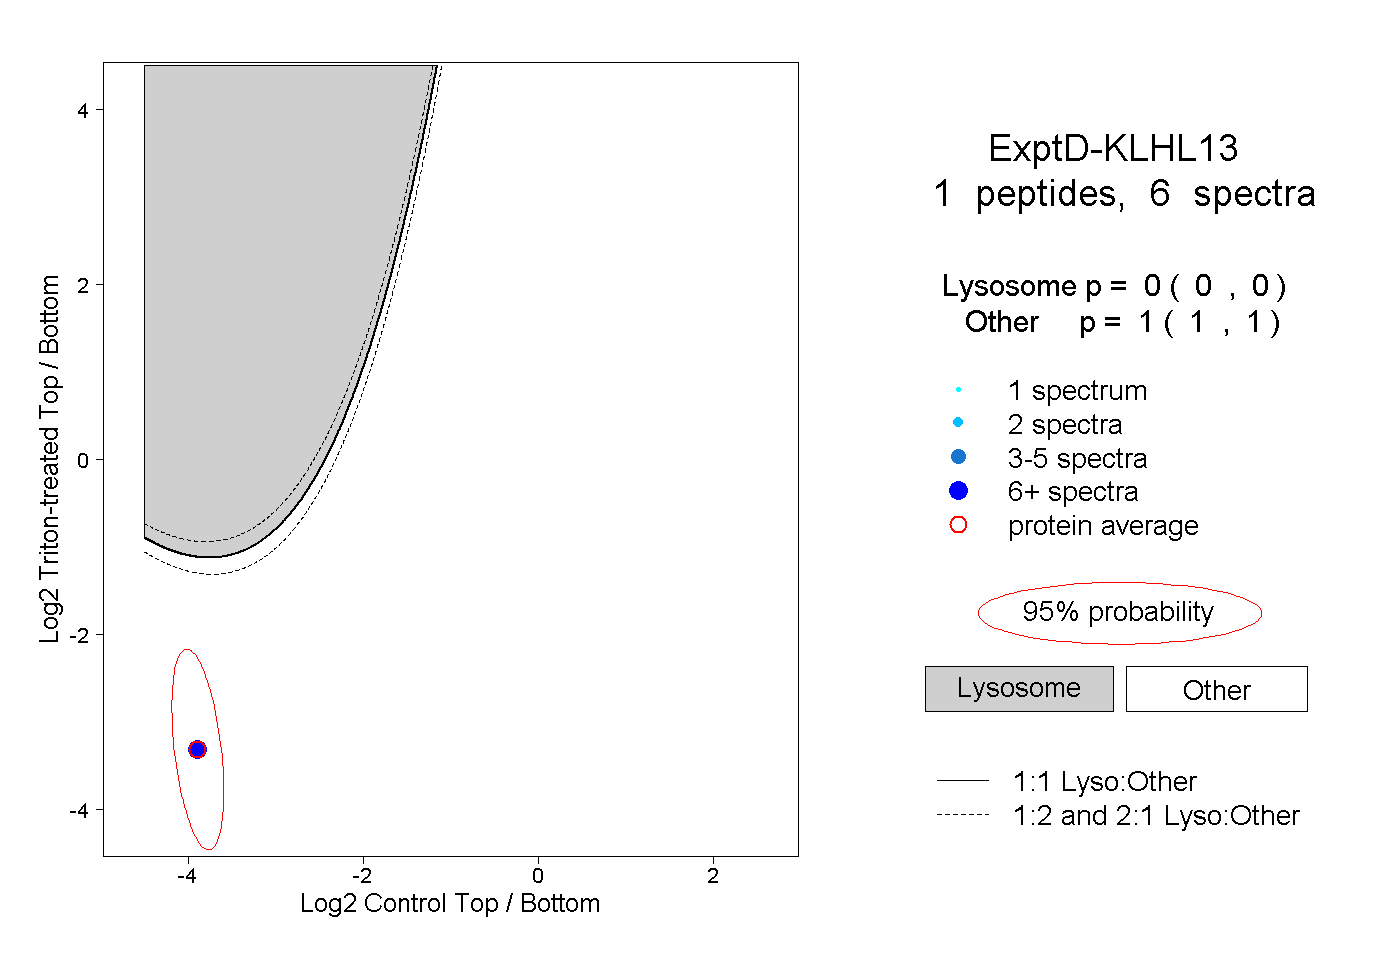
0.000 | 0.000
1.000 | 1.000