 1
1peptide
spectra
0.330 | 0.383
0.000 | 0.033
0.000 | 0.094
0.507 | 0.595
0.000 | 0.000
0.000 | 0.080
0.000 | 0.000
0.000 | 0.000
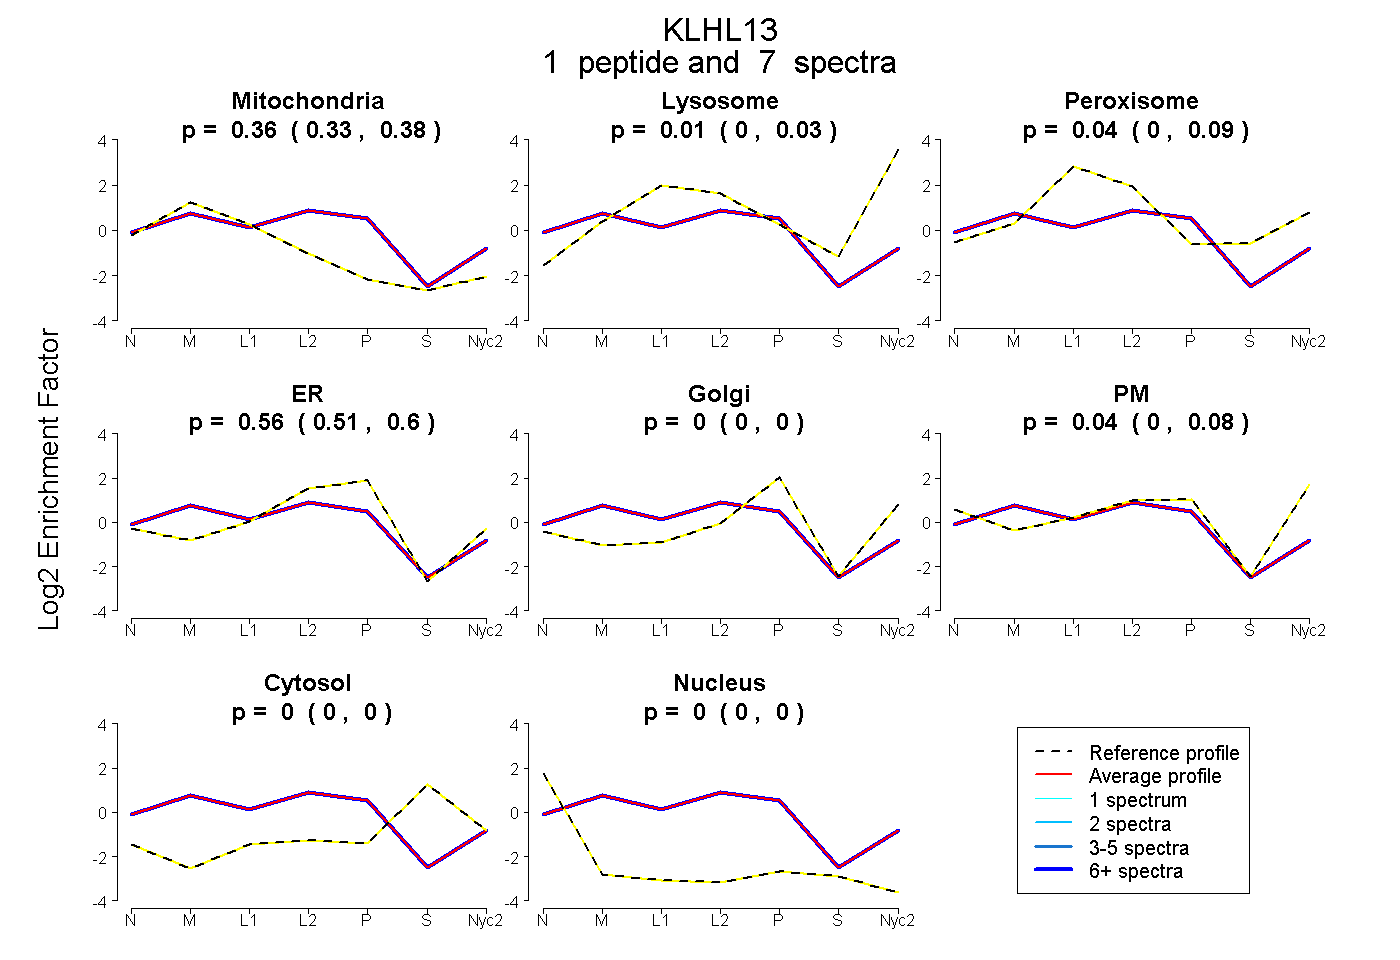
| Plot | Mito | Lyso | Perox | ER | Golgi | PM | Cytosol | Nucleus | |||||
| Expt A |
1 peptide |
7 spectra |
|
0.360 0.330 | 0.383 |
0.009 0.000 | 0.033 |
0.038 0.000 | 0.094 |
0.556 0.507 | 0.595 |
0.000 0.000 | 0.000 |
0.037 0.000 | 0.080 |
0.000 0.000 | 0.000 |
0.000 0.000 | 0.000 |
| 7 spectra, DILHR | 0.360 | 0.009 | 0.038 | 0.556 | 0.000 | 0.037 | 0.000 | 0.000 |
| Plot | Mito | Lyso or Perox | ER | Golgi | PM | Cytosol | Nucleus | ||||||
| Expt B |
2 peptides |
5 spectra |
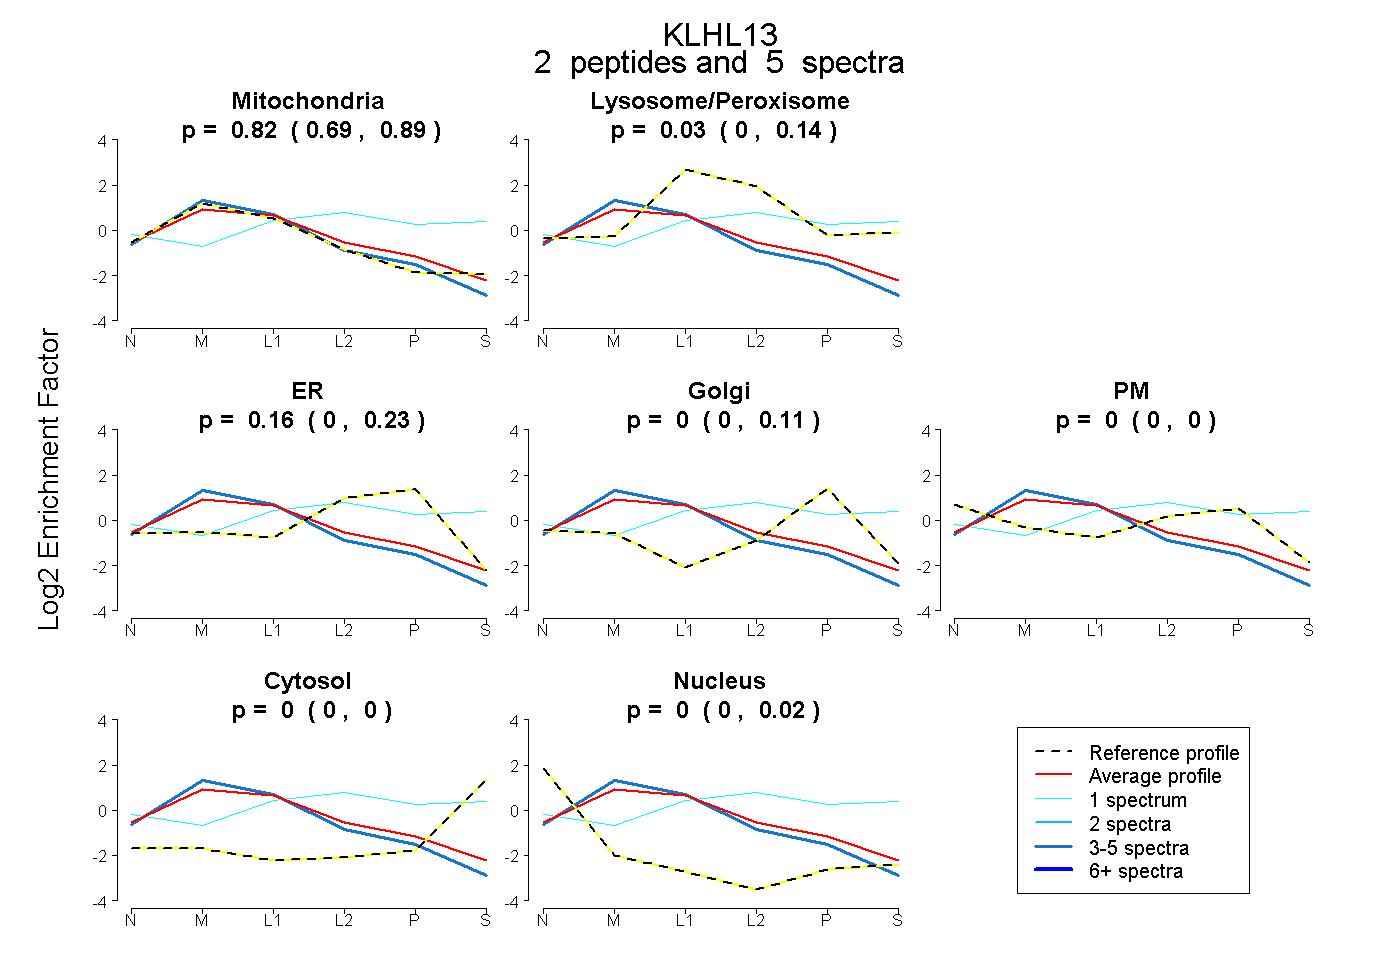 |
0.815 0.690 | 0.888 |
0.027 0.000 | 0.138 |
0.158 0.000 | 0.227 |
0.000 0.000 | 0.106 |
0.000 0.000 | 0.000 |
0.000 0.000 | 0.000 |
0.000 0.000 | 0.015 |
|||
| Plot | Lyso | Other | |||||||||||
| Expt C |
1 peptide |
20 spectra |
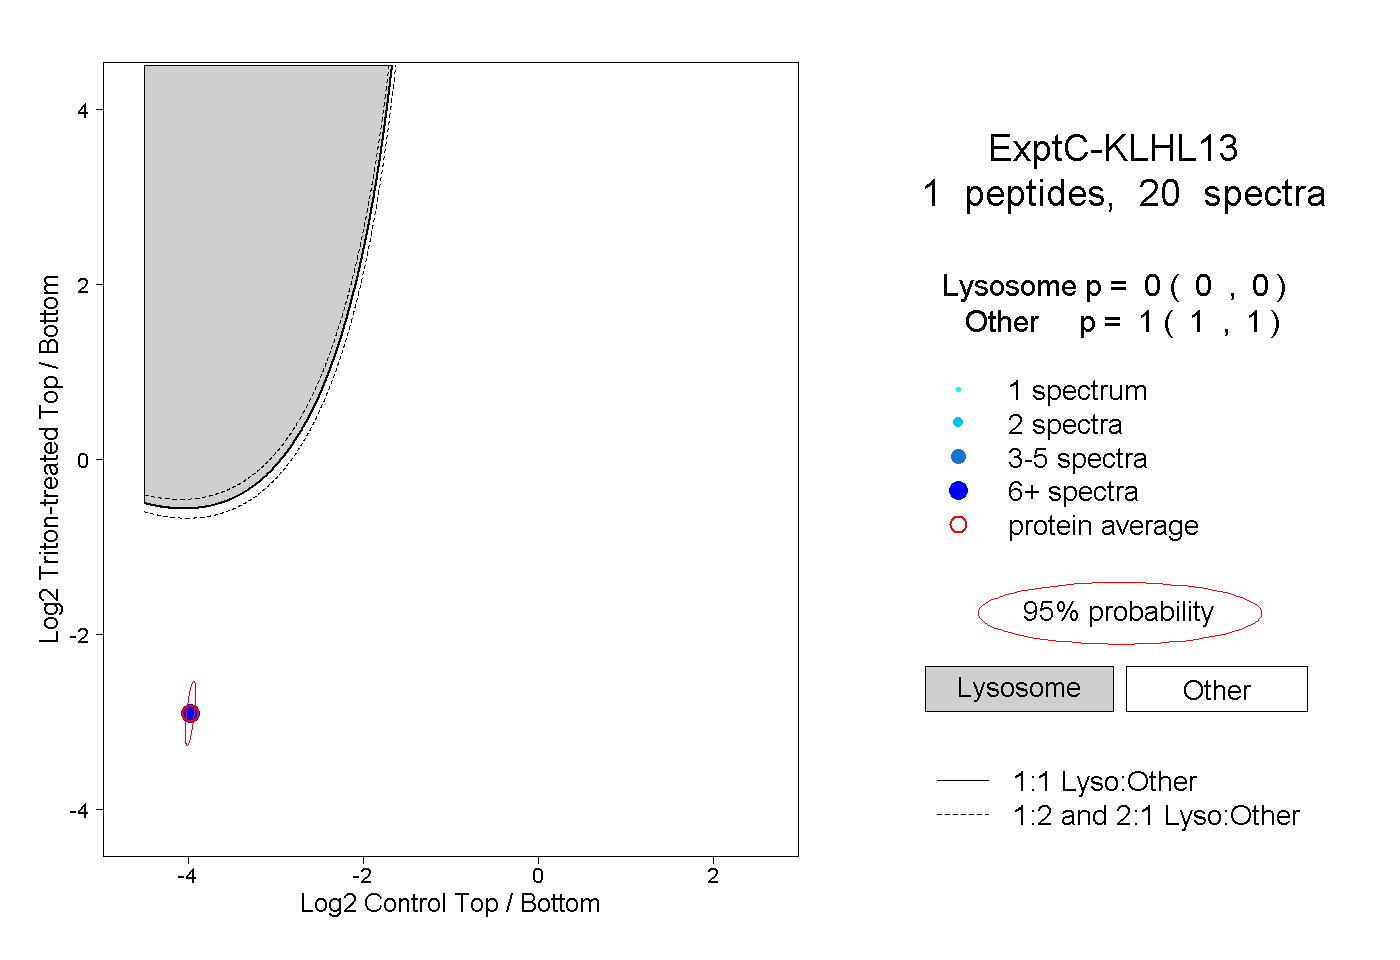 |
0.000 0.000 | 0.000 |
1.000 1.000 | 1.000 |
||||||||
| Plot | Lyso | Other | |||||||||||
| Expt D |
1 peptide |
6 spectra |
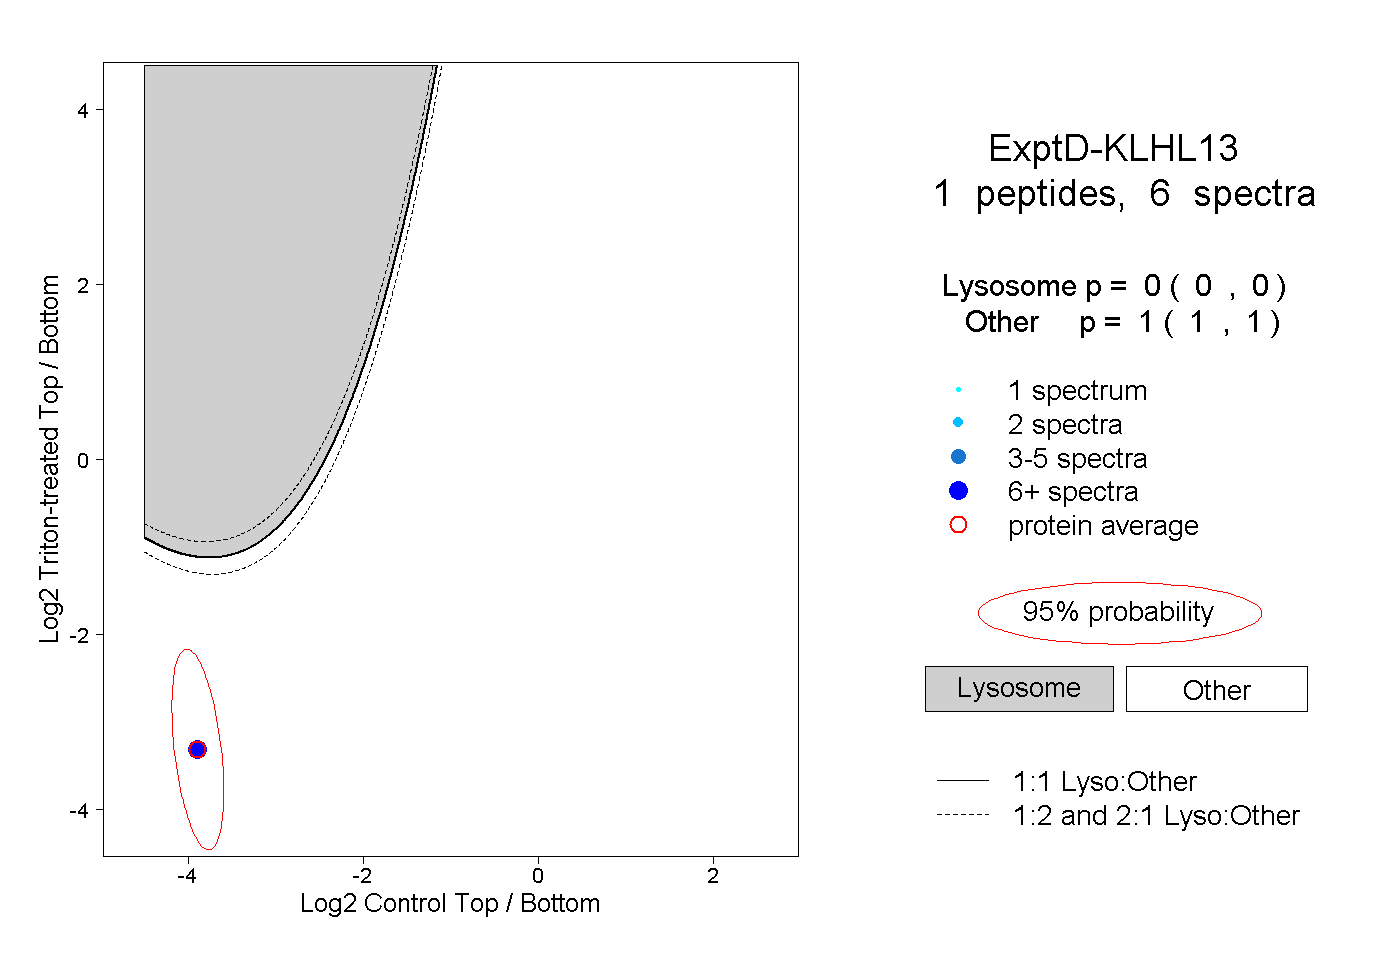 |
0.000 0.000 | 0.000 |
1.000 1.000 | 1.000 |