 7
7peptides
spectra
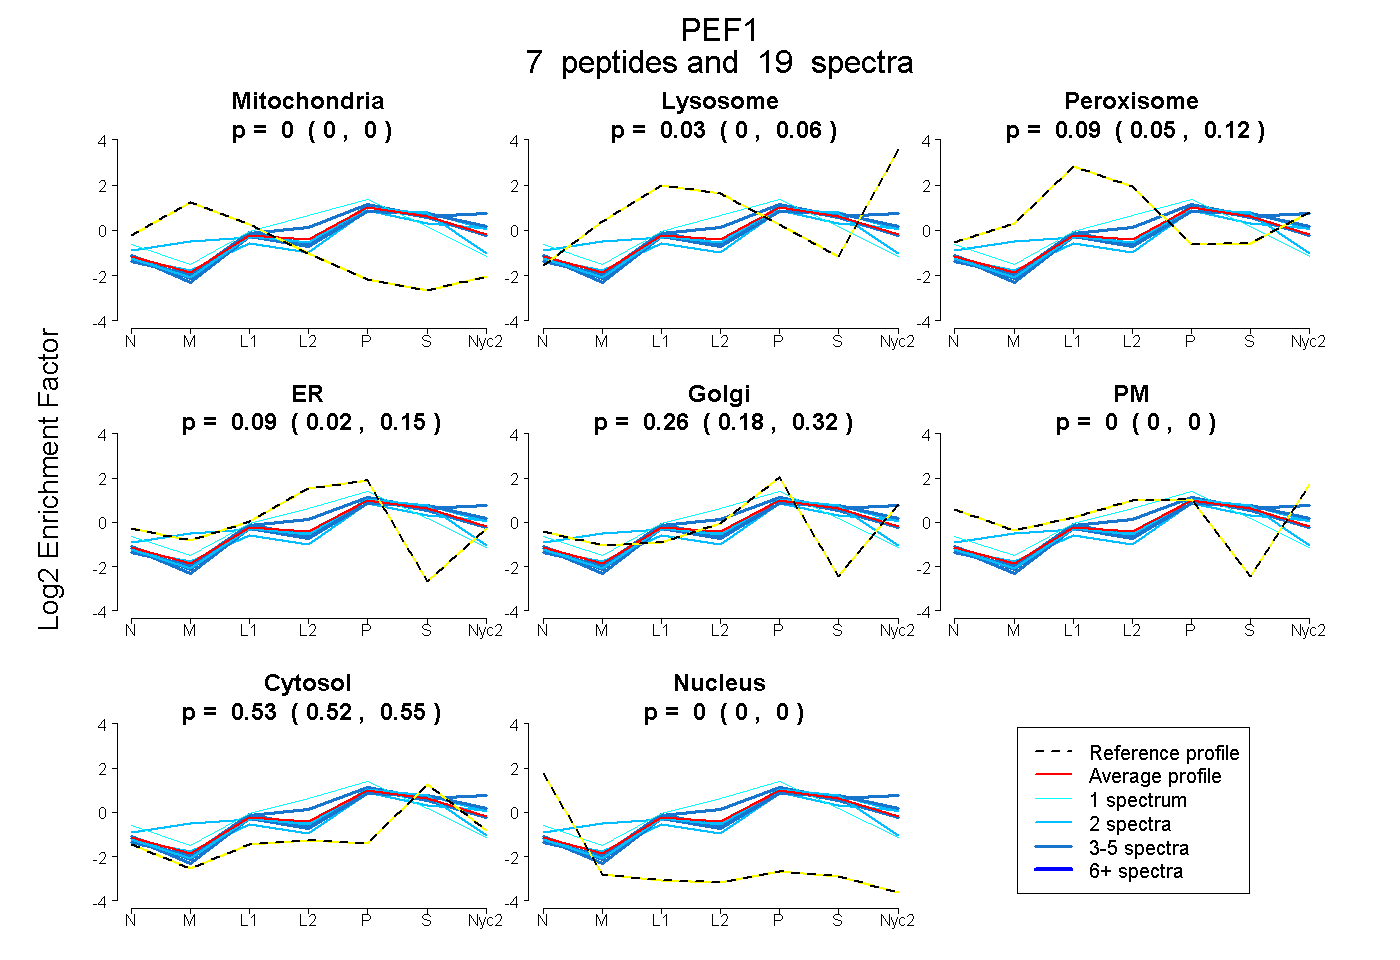
0.000 | 0.000
0.000 | 0.065
0.046 | 0.122
0.017 | 0.154
0.180 | 0.316
0.000 | 0.000
0.517 | 0.547
0.000 | 0.000
4peptides
spectra
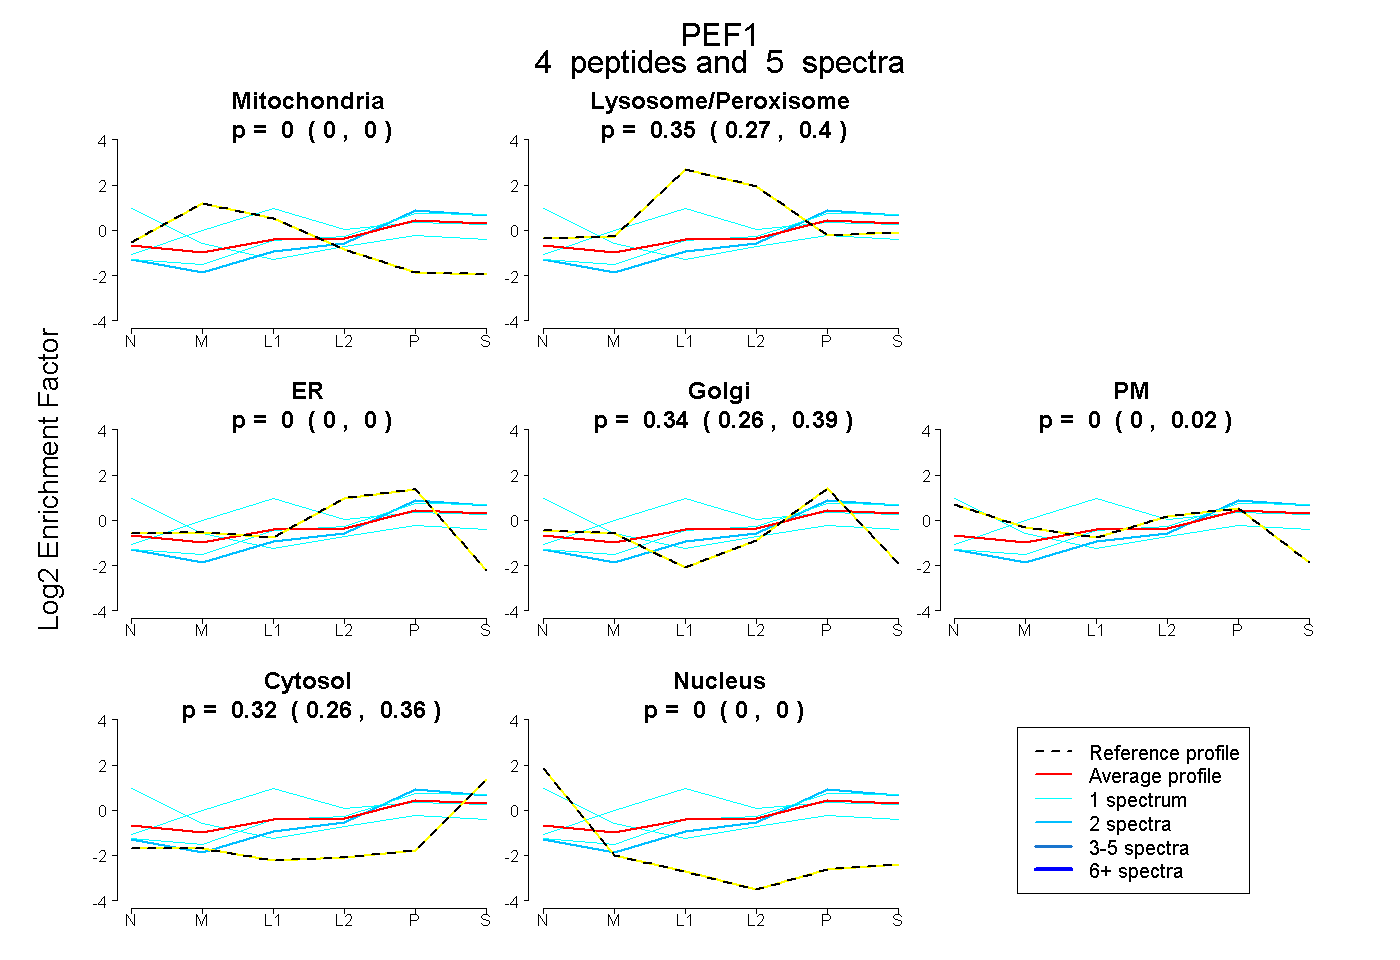
0.000 | 0.000
0.275 | 0.399
0.000 | 0.000
0.259 | 0.392
0.000 | 0.015
0.263 | 0.360
0.000 | 0.000
4peptides
spectra
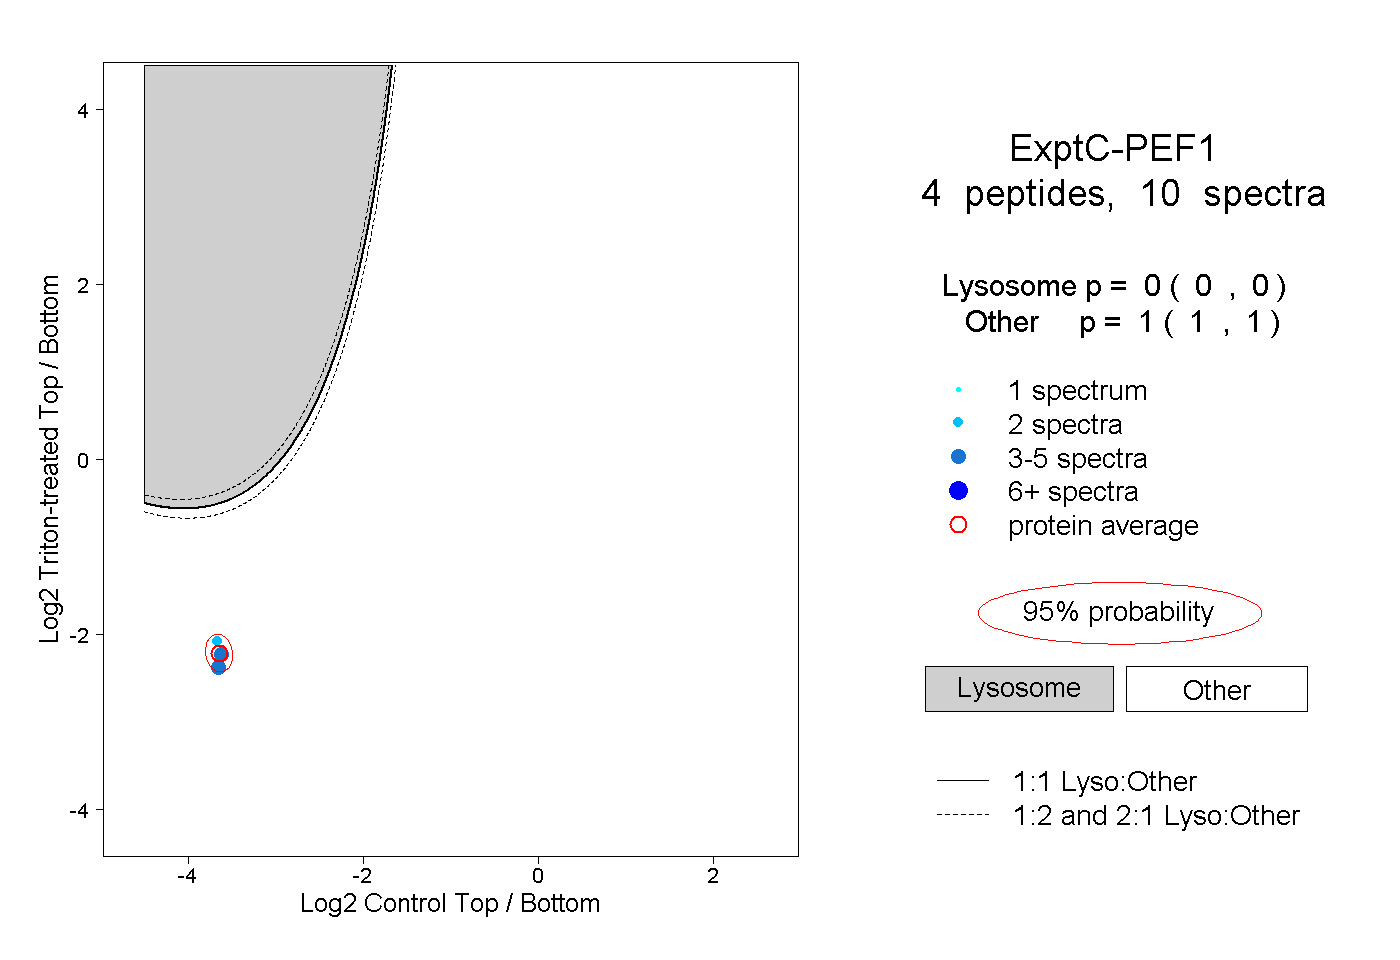
0.000 | 0.000
1.000 | 1.000
2peptides
spectra
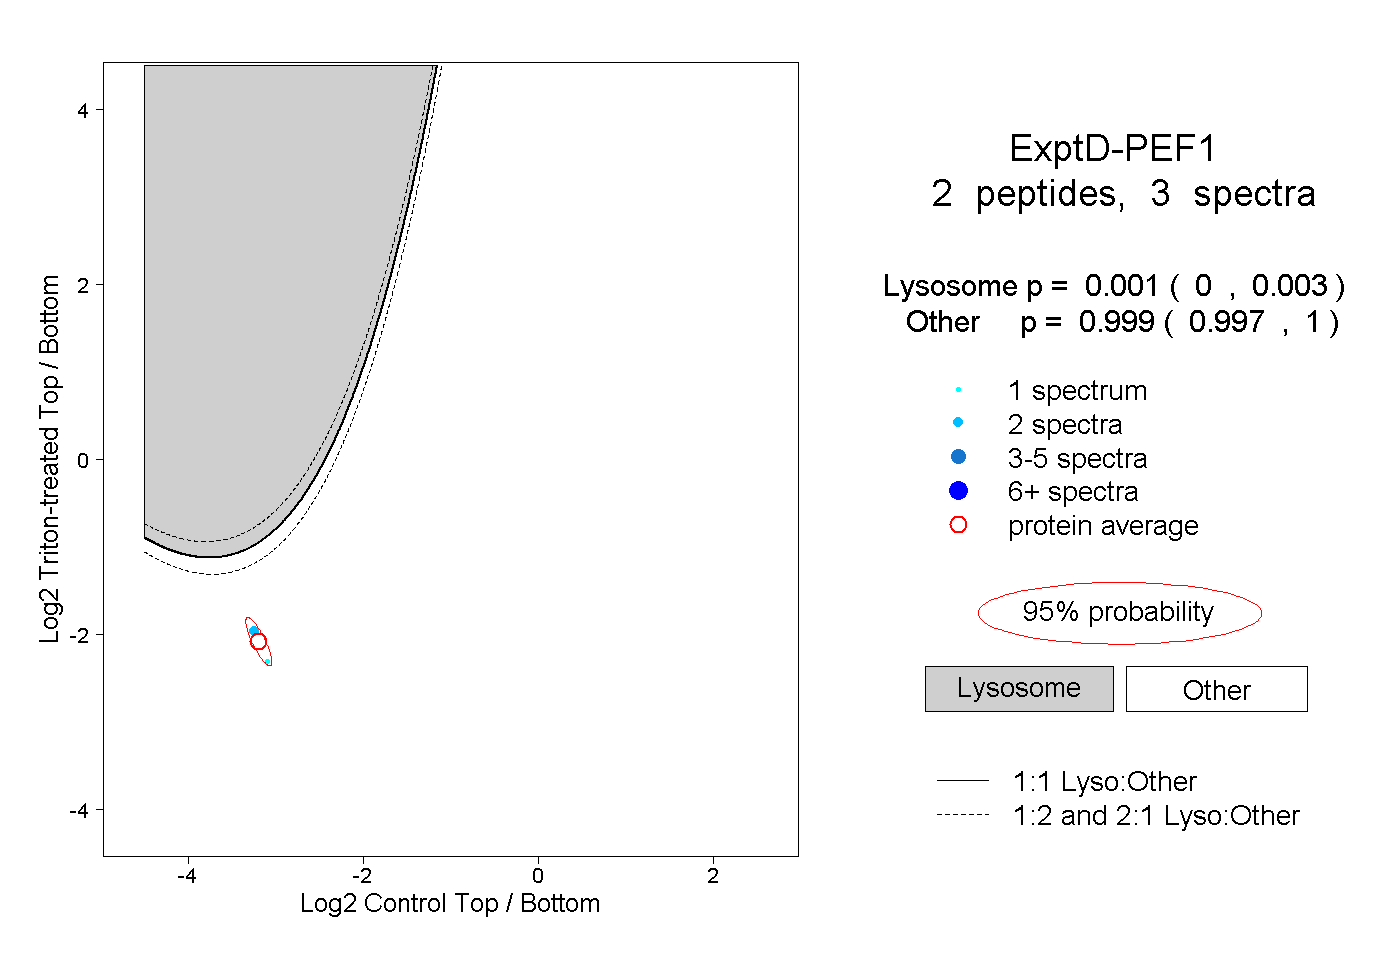
0.000 | 0.003
0.997 | 1.000